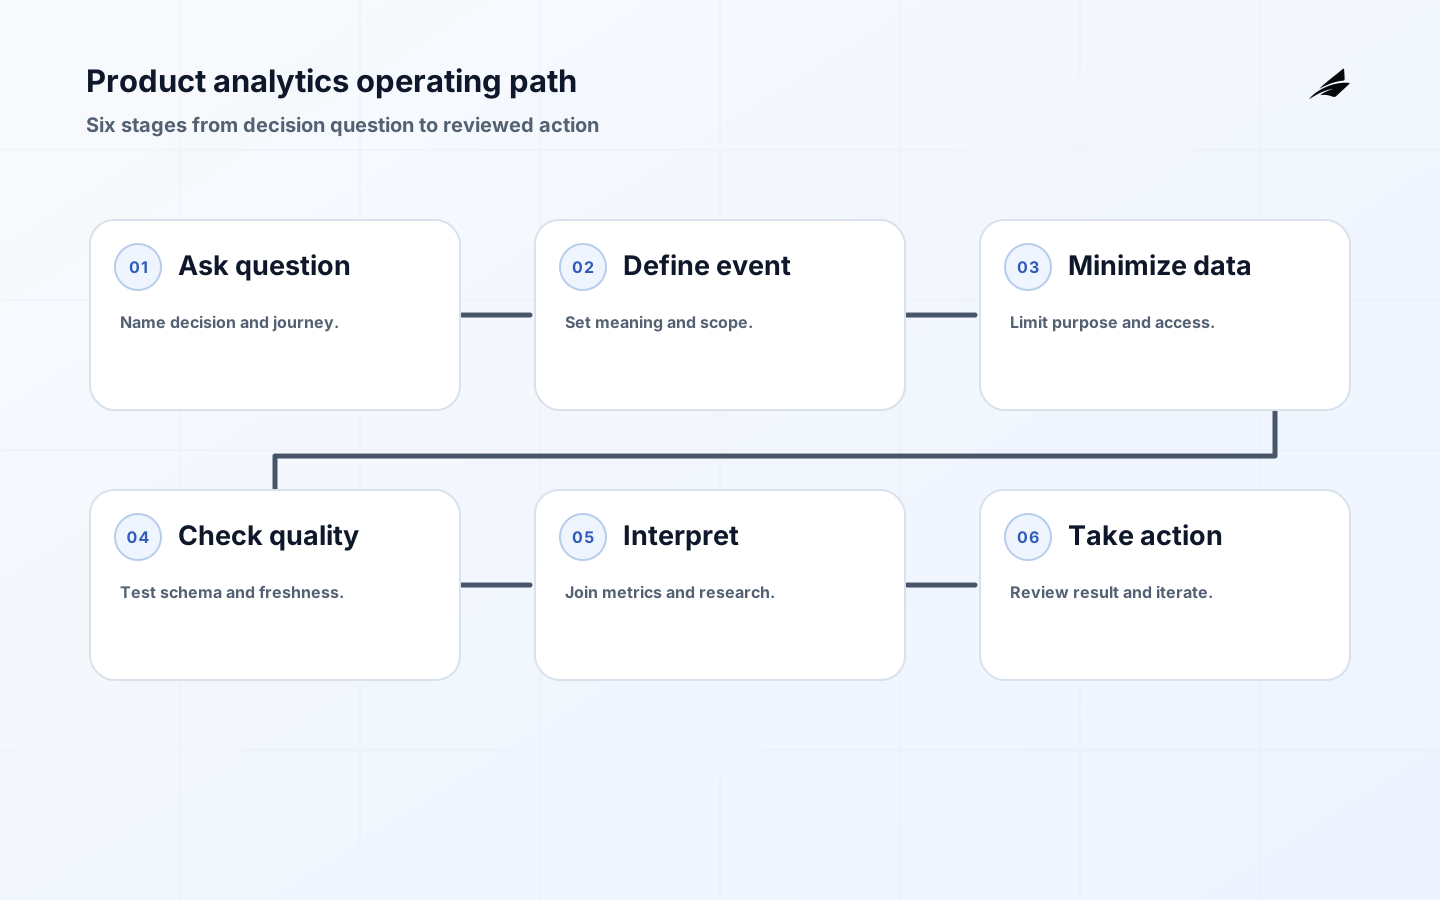
Product analytics becomes an IT management concern when teams use behavioral data to change a service, prioritize reliability work, allocate cost, or explain a customer outcome. The first question is not which dashboard tool to buy. It is which decision the organization needs to make and what evidence can support it without creating unnecessary privacy, quality, or operating risk. A useful product analytics system joins event definitions, application context, data quality, access controls, and review habits. This guide helps IT managers build that foundation around a real journey rather than a catalogue of every possible click.
Start with a decision question
Write the decision before the event. “Should we simplify workspace setup? ” is better than “track every setup click. ” Define the user, journey, expected outcome, time window, and action that would follow each result. The GOV. UK guidance on measuring services recommends combining performance measures with user research and warns against relying on digital analytics alone. For a SaaS team, that means pairing completion and latency with support contacts, feedback, and the cost of operating the workflow.

Choose one primary outcome, one quality guardrail, and one operational signal for the first slice. For a report builder, the outcome might be a completed report that a user exports successfully; the guardrail could be correction or re-run rate; the operational signal could be query latency or failed jobs. Define what counts as a start, a completion, a failure, and a correction. A metric without a state definition can look precise while measuring different things in different services.
| Measurement type | Question answered | Example |
|---|---|---|
| Outcome | Did the user accomplish the intended job? | Report exported with expected scope |
| Quality guardrail | Did success create a hidden problem? | Correction or repeat-work rate |
| Operational signal | Is the system dependable while it happens? | Latency, error, or queue age |
| Experience signal | Why did the result occur? | Survey, interview, or support reason |
| Cost signal | What does the workflow consume? | Compute, storage, or analyst time |
Create a small, owned event taxonomy
An event name should communicate a meaningful business or product state, not a UI implementation detail. Prefer workspace_invitation_completed to button_7_clicked, and define the actor, workspace, workflow version, outcome, and timestamp explicitly. OpenTelemetry semantic conventions show the value of common names and attributes across traces, metrics, logs, profiles, and resources. A shared vocabulary makes it easier to connect product behavior to service telemetry while still letting each system own the data it is designed to collect.
Assign an owner and lifecycle to every important event. The owner maintains the definition, validates producers, approves schema changes, and decides when an event can be retired. Version changes that alter meaning; do not silently reuse an event name for a new workflow. Keep a data dictionary with examples and exclusions. If analysts cannot tell whether an event is emitted before or after a transaction commits, the dashboard is not ready to guide a consequential decision.
| Field | Why it matters | Design choice |
|---|---|---|
| Event name | Keeps meaning stable | Describe domain state, not screen control |
| Subject scope | Supports correct segmentation | Pseudonymous user or workspace key |
| Version | Separates changed semantics | Schema or workflow version |
| Outcome | Distinguishes success from attempt | Completed, failed, pending, corrected |
| Source and time | Supports lineage and freshness | Producer, event time, processing time |
Apply purpose limitation and data minimization
Analytics data is still product data and may contain personal, confidential, or commercially sensitive information. The NIST Privacy Framework describes objectives such as predictability, manageability, and disassociability. Translate those ideas into design decisions: document why each field is collected, restrict who can query it, define retention, support correction or deletion workflows where required, and use aggregates or pseudonymous identifiers when raw identity is not needed.
Do not send free-form text, tokens, full email addresses, payment details, or document contents into an event merely because a tool accepts them. Review browser and mobile instrumentation separately because client data can be exposed to users and extensions. Use allowlisted attributes and schema validation. Make privacy review part of event creation, not a cleanup task after dashboards have been shared widely. A smaller dataset is often easier to explain, protect, and keep accurate.
Treat data quality as a production property
Measure the analytics system itself. Check event volume against expected traffic, required fields, duplicate rate, late arrivals, schema violations, and the proportion of events with an unknown version. Alert when a critical event disappears after a deployment. Keep event time separate from processing time so delayed mobile or batch activity is not interpreted as current behavior. If a metric changes sharply, check instrumentation, release changes, and data pipelines before declaring a customer trend.
OpenTelemetry’s metrics model separates instrumentation from SDK configuration and supports correlating metrics with other signals. Use that separation to keep collection logic close to the workflow while allowing operational teams to control exporters, sampling, and retention. Keep cardinality under control: a unique request or document identifier in a metric label can create cost and query problems. Put high-cardinality identifiers in traces or controlled event records instead.
Make analysis lead to an action
Dashboards should answer a decision question at the right cadence. A support lead may need a current failure queue, while a product review may need a weekly cohort comparison. Add context such as release version, segment definition, baseline, uncertainty, and known collection gaps. Do not use an aggregate average when a new workspace, returning user, or large tenant behaves differently enough to change the decision. Segment carefully and document why the segment exists.
Pair analysis with a human review path. If completion falls, inspect the workflow, read support reasons, and reproduce the journey. If completion rises while correction work rises too, pause the rollout and investigate. IT managers can create a useful operating rhythm: analysts or product owners interpret behavior, engineers validate instrumentation and service state, privacy owners review data use, and support contributes the customer language that a chart cannot provide.
Create an event review checklist for every new decision-critical event: purpose, owner, producer, schema, subject scope, timing, version, privacy classification, retention, quality check, and downstream consumers. Review it when a workflow changes. This small gate prevents the common failure where a dashboard remains live while the product behavior has moved and the event quietly means something else. It also gives IT a concrete inventory for cost and access review.
When a metric changes, use a triage order that protects trust: check collection health, schema and deployment changes, segment definitions, service telemetry, and qualitative reports before changing the roadmap. If the data is incomplete, label it incomplete. A visible gap is easier to repair than an apparently exact metric that leads the team to invest in the wrong behavior. Analytics governance is mostly the discipline of making uncertainty legible.
Give the event catalogue a visible change process. A producer that changes a field should publish the new schema, identify affected dashboards and alerts, and allow a short compatibility window when downstream consumers need time to migrate. Retire events only after confirming that no decision-critical report depends on them. This prevents a harmless-looking refactor from quietly breaking the evidence used by product, support, or operations.
Budget analytics like any other production capability. Estimate storage, query, export, and retention costs; set access boundaries; and review whether high-cardinality attributes are earning their cost. When a team can answer the purpose, owner, quality, privacy, and cost questions for an event, the catalogue is ready to support a decision. When it cannot, instrument less and clarify more before adding another dashboard.
Set a review date for critical dashboards and reports. A report should have a named consumer, an action it informs, a freshness expectation, and a rule for what happens when the data is late or incomplete. Retiring a dashboard that no longer drives a decision reduces query cost and prevents old definitions from competing with the current product vocabulary.
Key takeaways
- Start with a decision and a customer journey, not a request to track everything.
- Define outcome, quality, operational, experience, and cost signals with stable meanings.
- Use an owned event taxonomy with explicit scope, version, timing, and lifecycle.
- Apply purpose limitation, access control, retention, and minimization to analytics data.
- Monitor schema, volume, latency, duplicates, cardinality, and missing critical events.
- For related delivery context, See roadmap systems, feature flags, and usage reporting.
Frequently asked questions
For each product decision, capture the event definition, timestamp, actor or account context, privacy basis, and current metric state before selecting the next analytical or operational action. Treat product analytics as evidence collection, not a dashboard exercise.
Choose one important journey and measure its intended outcome, a quality guardrail, and an operational condition. For example, onboarding completion can be paired with support escalation and provisioning latency. This gives the team enough evidence to act without creating a broad event catalogue that nobody can maintain.
How is product analytics different from observability?
Product analytics explains user and business behavior; observability helps explain system state from telemetry such as traces, metrics, and logs. They overlap in workflow identifiers and timestamps, but they serve different questions. Joining them carefully helps teams distinguish a real behavior change from a slow service or missing instrumentation.
How should personal data be handled?
Collect only what supports a documented purpose, use pseudonymous or aggregate data when sufficient, restrict access, define retention, validate schemas, and avoid free-form or secret values. Include analytics in privacy risk review and make deletion or correction requirements visible to the teams that own the pipeline.
Who owns the event taxonomy?
Assign one accountable owner, but maintain the taxonomy with product, engineering, privacy, analytics, and operations input. The owner should approve semantic changes, publish definitions, review quality, and retire events when the workflow or decision no longer needs them.
Conclusion: make evidence trustworthy
Product analytics is valuable when it helps a team make a better decision and understand the consequence of acting on it. Start with a journey, define meaningful events, minimize data, monitor quality, and combine quantitative evidence with research and support context. That operating model gives IT managers a way to improve the product while keeping privacy, cost, and reliability visible.
For how IT managers should think about product analytics, a good handoff ends with observable evidence rather than a verbal promise. For product analytics, review the think about product analytics control during normal handling.
The smallest useful improvement to how IT managers should think about product analytics is often a sharper boundary, not another feature. For product analytics, record the state, evidence, and recovery path.
For how IT managers should think about product analytics, test a revoked permission before treating the first release as complete. Test product analytics with normal, delayed, denied, and corrected workflow cases.
A practical example for how IT managers should think about product analytics is an older fact arrives after a newer decision.
This decision also connects to Product Analytics Cost and Scaling: Keep Quality Ahead of Volume, Usage Reporting: Hands-on Planning Guide, Roadmap Systems Security Review for SaaS Teams. Review those boundaries together when how IT managers should think about product analytics shares identity, data, billing, or support evidence with another workflow.
For Product Analytics, OpenTelemetry Semantic Conventions define scope; OpenTelemetry Metrics support the control. Reconcile changes to product analytics against the original record.
Evidence for “How IT Managers Should Think About Product Analytics” is grounded in OpenTelemetry Semantic Conventions, OpenTelemetry Metrics, NIST Privacy Framework 1.0, GOV.UK: Measuring the success of your service; each source informs a specific decision, test, or operating trade-off described in this guide.