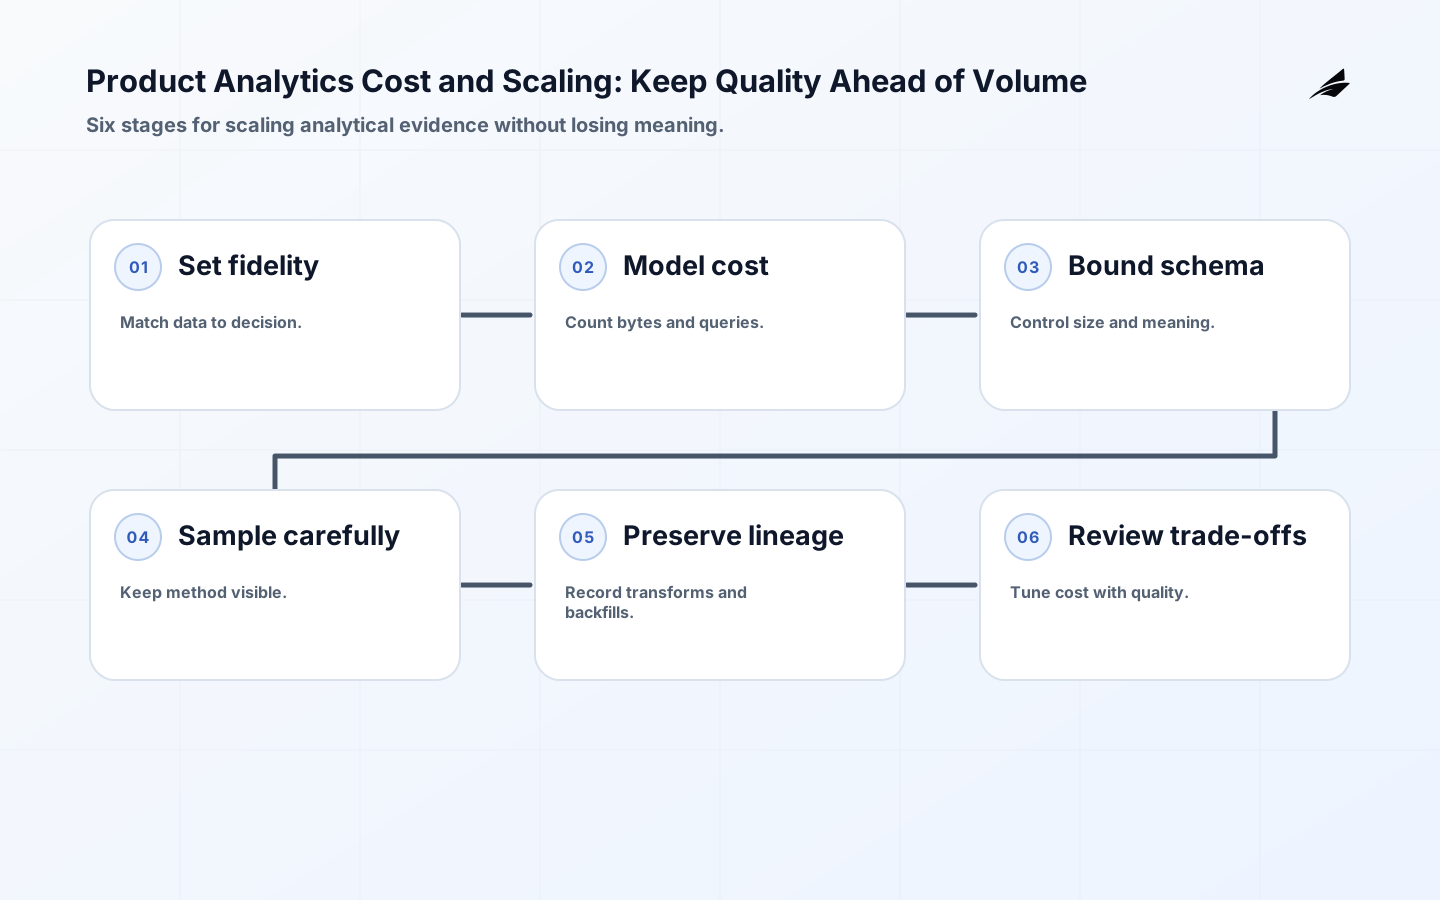
Product analytics cost rarely arrives as one obvious bill. It appears as client payloads, ingestion, storage, retention, transformations, dashboard queries, exports, support investigations, and the engineering time spent repairing ambiguous events. Scaling the volume without a contract can make the system more expensive and less trustworthy at the same time. This guide gives operations leaders a way to decide what deserves full fidelity, what can be aggregated, where sampling is safe, and how to prove that a cost reduction did not silently change the business answer. Pair it with the plain-language guide to product analytics and the product analytics production guide.
Set the product analytics scaling boundary
Begin with the decisions the data must support and separate them by fidelity. A security investigation, billing reconciliation, or reliability incident may require complete, attributable records. A product trend may use an aggregate or statistically appropriate sample. A funnel denominator can be invalid if dropped events are not understood. Write a purpose, acceptable delay, required completeness, retention period, and audience for each data class. This avoids the common response of retaining everything forever because no one has agreed what could be removed. It also tells the platform team where an expensive guarantee creates real product value.
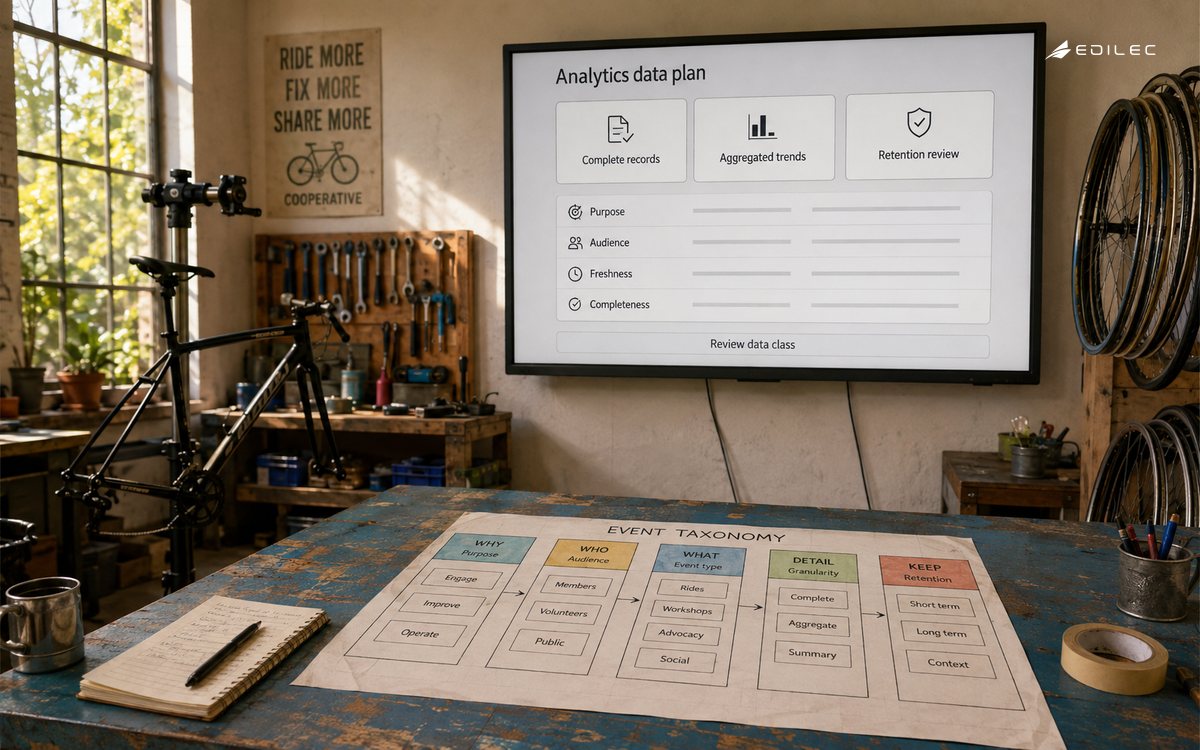
| Data class | Fidelity decision | Scaling control |
|---|---|---|
| Decision-critical outcome | Complete or reconciled record | Schema validation and durable storage |
| Exploratory interaction | Bounded sample or short retention | Sampling rule and expiry |
| Operational correlation | Stable key, limited attributes | Access policy and redaction |
| Executive trend | Aggregated measure with denominator | Precomputed rollup and freshness check |
Build a cost model around behaviour, not tool names
Estimate events per active account, bytes per event, daily growth, retention days, query scans, and export volume. Separate steady-state traffic from release experiments, replay jobs, and backfills. Include the cost of duplicate events and oversized properties because a small schema mistake can multiply downstream work. RFC 9110 is a useful reminder that request semantics include method, status, caching, and intermediaries; analytics instrumentation should distinguish a request attempt, a response, and a retried operation rather than counting every network interaction as a user outcome. A cost model that maps technical volume to business units is easier to challenge and adjust than one that reports a single aggregate.
Control schema growth before it becomes a scaling problem
Every new property creates review, storage, query, access, and retention obligations. Require a purpose and owner for additions, prefer bounded enums or numeric values over free text, and set a size limit at ingestion. Keep a compatibility policy so consumers know whether a field may disappear, change type, or change meaning. Version a breaking change and allow old and new producers to coexist for a deliberate period. For example, replacing a long error message with a reason code lowers payload size and makes reporting comparable, but only if the code catalogue and migration are clear. Cheap data that cannot be interpreted is still expensive.
Use sampling only where the decision allows it
Sampling is a decision about evidence, not merely an ingestion optimisation. Define the population, selection method, sample rate, weighting or extrapolation rule, and confidence limitation. Do not sample away the events needed to diagnose a rare security failure or prove a commercial entitlement. Keep complete counters for metrics that need exact totals, and mark a dashboard when its underlying series is sampled. Compare a sample against a smaller full-fidelity reference window after rollout. If the sample changes the product decision, restore fidelity or redesign the question rather than arguing with the chart.
| Situation | Safe first move | Do not hide |
|---|---|---|
| High-volume page views | Aggregate by approved dimensions | Unique-user or account denominator |
| Rare failure | Keep all failures and bounded context | Outcome, release, and affected scope |
| Experiment exposure | Use a stable assignment record | Eligibility and treatment version |
| Long-term trend | Downsample after an audited window | Method, time basis, and revision history |
Tie retention and access to the analytical purpose
A short-lived raw event and a long-lived aggregate should not share an automatic retention rule. Document when raw attributes stop being useful, which derived measures remain, and how deletion or correction affects both. Restrict exports and query access according to purpose; an operations dashboard may need correlation identifiers that a broad product report should never expose. OWASP's application security verification work is a useful prompt to review validation, access control, and data exposure as a system, not as separate checkboxes. Cost pressure is often a good moment to remove unnecessary sensitive detail, but the change still needs an owner and a record of what evidence will remain.
Instrument the analytics pipeline itself
OpenTelemetry documentation separates traces, metrics, logs, and context so teams can choose appropriate signals. Apply that separation to the analytics path: measure accepted, rejected, late, duplicated, sampled, transformed, and queried records; trace a representative event through ingestion and transformation; and log schema or policy changes with a responsible actor. Do not attach every event property to every technical signal. A small set of stable dimensions—producer, schema version, environment, pipeline stage, and correlation key—usually explains more with less cost and exposure. Alert on material quality or freshness changes, not every normal fluctuation in traffic.
Preserve lineage when reducing volume
W3C PROV-DM describes how entities, activities, agents, derivations, and responsibility can explain the origin of a result. For a scaled analytics platform, retain an audit-friendly lineage record: source event contract, transformation version, aggregation window, sample rule, backfill identifier, and publishing owner. When an executive trend changes after a query rewrite, the team can distinguish the customer signal from the method. Lineage is especially important for correction work. If an old event definition was wrong, record which reports were affected and whether a reprocessing action changed their historical interpretation.
Review cost, quality, and decision usefulness together
A monthly review should put unit cost beside completeness, duplicate rate, freshness, query latency, incident load, and the decisions enabled. Ask whether a large dataset led to a better product choice or merely supported a familiar dashboard. Review top properties by size and access, top queries by scan, and top repair causes by engineering time. Then choose one change: shorten retention, replace free text, precompute a rollup, lower query frequency, or keep fidelity because an important decision depends on it. Each change should state the expected saving and the quality guardrail that will prove the saving is safe.
Scale in stages with a reversible threshold
Start with one product journey, one audience, and one retention or sampling policy. Establish a full-fidelity baseline before introducing aggregation. Expand only after the quality checks, cost model, access controls, and rollback path have been exercised against real traffic. Preserve a small reference stream that is not subject to the new optimisation so the team can compare results. If the comparison diverges beyond the agreed tolerance, pause the change and inspect definitions, not just infrastructure. This makes scaling a controlled product decision instead of a surprise caused by an invoice or a dashboard discrepancy.
Use a reference stream when scaling
Suppose a high-volume interaction stream is reduced to a sample to lower storage and query cost. Keep a smaller, complete reference stream for a bounded set of accounts or a fixed period. Compare the sampled trend with the reference after each change in sampling, transformation, or identity logic. Check both the direction of movement and the decision threshold that matters to the team. If a dashboard says activation improved while the reference stream shows a missing producer, the optimisation has created a false positive. The reference does not need to remain forever; it needs a documented purpose and retirement date. This pattern gives an operations team a practical way to scale while retaining an independent check on completeness, denominator behaviour, and release-related changes.
A useful cost review includes a decision log for every optimisation: what volume or query pattern changed, which user outcome must remain stable, what quality tolerance applies, and when the change will be checked. This avoids treating an infrastructure saving as self-justifying. If a rollup removes detail, retain a route to inspect the material exceptions. If a property is shortened or retired, document the effect on existing reports. The review is complete only when the team can explain both the saving and the evidence that protects the original product question.
Key takeaways
- Tie fidelity and retention to the decision the data must support.
- Model event, storage, query, export, replay, and repair costs in business units.
- Control schema size and meaning before volume makes changes expensive.
- Sample or aggregate only when the population, method, limitation, and denominator remain visible.
- Keep pipeline quality, lineage, and access evidence alongside cost metrics.
- For adjacent operating detail, See onboarding flows engineering notes and product support tooling implementation checklist.
Frequently asked questions
Is the cheapest analytics system the best one?
Not if it removes the evidence needed for a material decision or creates enough repair work to erase the saving. Compare total operating cost and decision quality, not ingestion price alone.
How should sampling be explained to readers?
State the population, sampling method, coverage period, weighting, freshness, and limitation near the metric. If a reader cannot tell that a value is sampled, the presentation is likely to create overconfidence.
What should happen during a backfill?
Version the source and transformation, label the run, preserve the previous result where it matters, reconcile counts, and announce which reports may change. A backfill is a data product change with an owner, not just a batch command.
Conclusion: scale the evidence, not the noise
Product analytics scales well when the team knows which evidence must remain exact, which detail can expire, and how a transformed result can be traced back to its source. Model cost in the same language as quality and decisions. Then make one measured change at a time, retain a reference path, and keep the meaning visible to the people who rely on the result. The outcome is a smaller, clearer, and more durable analytics system—not simply a larger event warehouse.
The measurement plan for product analytics cost and scaling should pair an outcome with a reason to investigate it. Explain product analytics cost and scaling pending and denied states before expansion.
A durable operating note for product analytics cost and scaling records the assumptions that made the decision safe: the authoritative source, effective time, permitted actor, protected resource, and recovery route. Give product analytics cost and scaling a named owner and a review date for and scaling guide.
For product analytics cost and scaling, a good handoff ends with observable evidence rather than a verbal promise. For product analytics cost and scaling, record the state, evidence, and recovery path.
This decision also connects to Onboarding Flows: Engineering Notes for SaaS, Product Support Tooling Implementation: A Safe Operations Checklist, How Product Teams Should Think About Feature Flags. Review those boundaries together when product analytics cost and scaling shares identity, data, billing, or support evidence with another workflow.
For Product Analytics Cost and Scaling, RFC 9110: HTTP Semantics defines scope; OWASP Application Security Verification Standard supports the control; OpenTelemetry Observability Primer clarifies evidence; PROV Data Model guides recovery; Monitoring Systems with Advanced Analytics frames review. Keep customer language aligned with the recorded state for product analytics cost and scaling.
Evidence for “Product Analytics Cost and Scaling: Keep Quality Ahead of Volume” is grounded in RFC 9110: HTTP Semantics, OWASP Application Security Verification Standard, OpenTelemetry Observability Primer, PROV Data Model, Monitoring Systems with Advanced Analytics; each source informs a specific decision, test, or operating trade-off described in this guide.