Industrial Dashboard Planning: Define Decisions First
The most expensive industrial dashboard mistake is building a wide screen before agreeing on the decision it must support. A team can spend months integrating tags, designing charts, and tuning colors while operators still cannot tell whether a value is current, trustworthy, actionable, or within their authority to change. Before the first build, define the user, asset, decision, time horizon, consequence, fallback, and owner. NIST’s Guide to Operational Technology Security is a useful reference because industrial systems have safety, timing, reliability, and maintenance constraints that should shape the product boundary from the start.
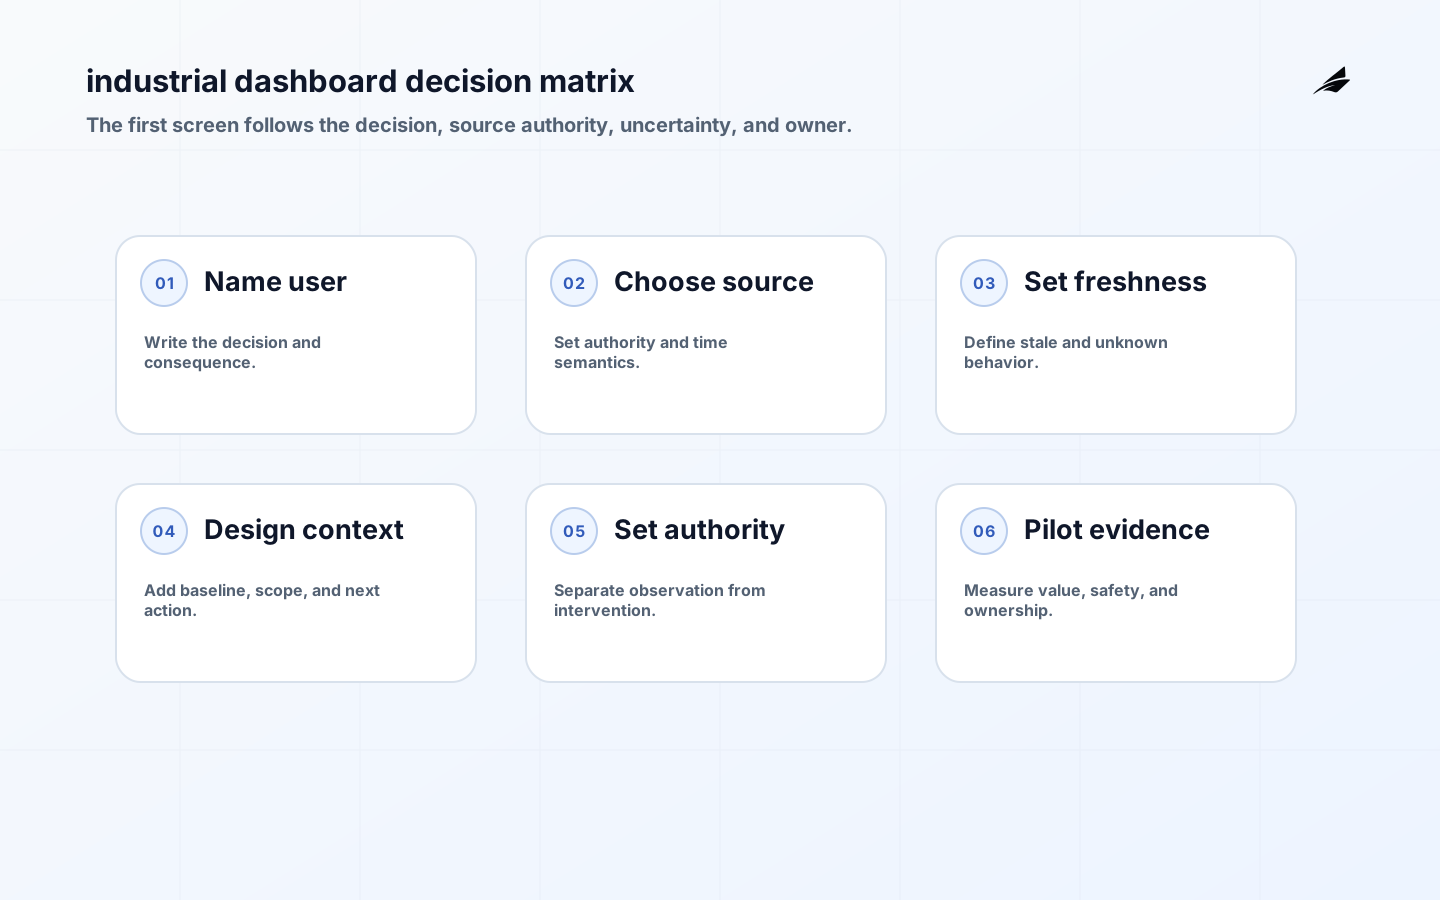
Name the decision and the person making it
Write a sentence that includes the actor, condition, action, and acceptable response time. “Give operations visibility” is not a test. “Help the shift supervisor decide whether to call maintenance when a compressor’s vibration pattern departs from its approved baseline” is testable. Observe how that decision is made today, including spreadsheets, radio calls, local panels, and tacit knowledge. Link to what changes when industrial dashboards move into production for the later service-readiness questions. The first dashboard should remove one meaningful ambiguity rather than expose every available signal.
| Decision to settle | Why it matters | Artifact |
|---|---|---|
| Who acts? | Role and skill determine wording, access, and context. | Named user and accountable owner. |
| What changes? | A trend, exception, command, or handoff needs different UI. | Decision statement and example. |
| How fast? | Freshness and alerting depend on response time. | Time target and stale rule. |
| What if uncertain? | Operators need a safe fallback, not a blank screen. | Manual procedure and escalation. |
Choose authoritative sources and time semantics
List every candidate source and decide which one is authoritative for each fact. A historian may be authoritative for a stored trend, while a local controller is authoritative for current state. A maintenance system may own work-order status, and a manual inspection may override a sensor interpretation. Define source time, ingestion time, aggregation window, correction behavior, and retention. Do not combine values with different time semantics in one visual without explaining the difference. Capture quality states such as missing, delayed, estimated, manually corrected, or out of range. A dashboard is only as honest as its source contract.
Set freshness and uncertainty rules
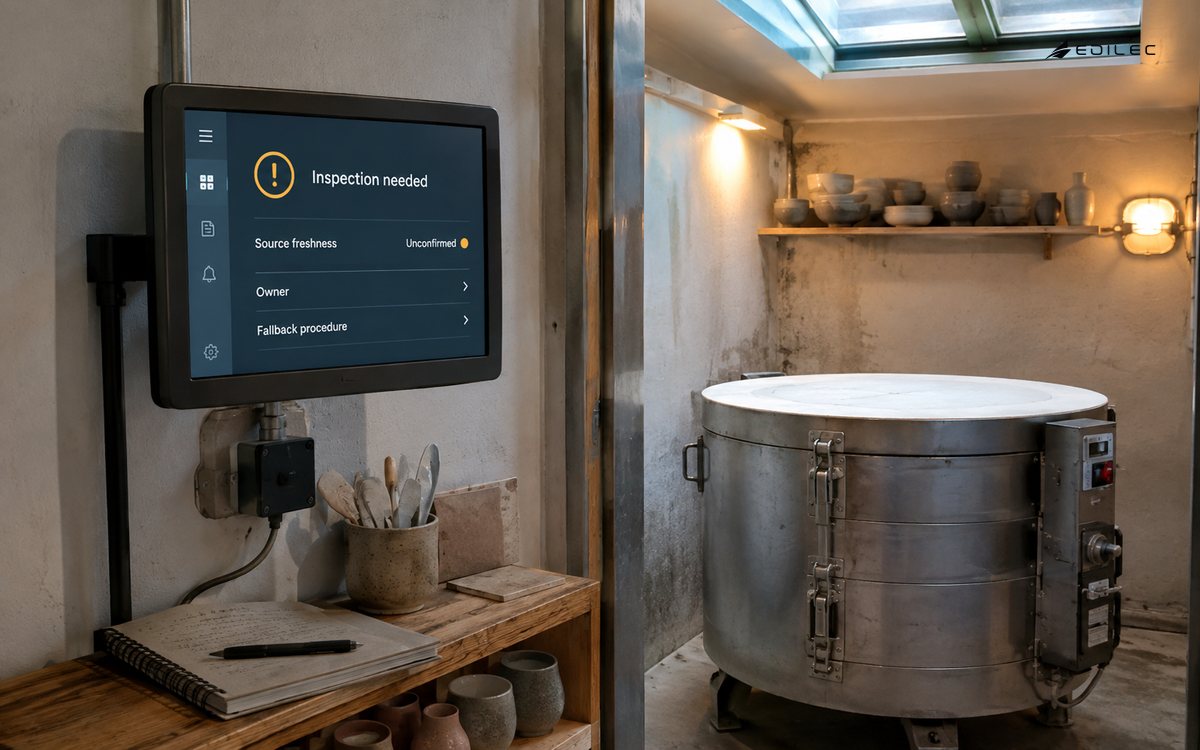
Freshness should be tied to the decision rather than chosen as a generic platform number. A monthly energy trend can tolerate a different delay from a pump condition alert. Define the last-good interval, stale threshold, late-arrival handling, and display treatment. Decide whether to omit an unavailable value, show the last known value with age, or show an explicit unknown state. Test the rule with delayed, duplicated, out-of-order, and corrected events. If a user can make a consequential decision from the screen, uncertainty must be visible at the same level of prominence as the measurement.
Design context before chart type
A number becomes useful when its operator can compare it with an appropriate baseline and understand the next action. Decide whether the context is a normal range, prior shift, production recipe, asset peer group, or approved threshold. Avoid decorative visual complexity that hides units, scale, or time. Describe what a user should notice first and what evidence supports escalation. Use WCAG 2.2 when specifying labels, focus order, keyboard access, contrast, color use, and responsive behavior. Accessibility is part of operational reliability because a control-room surface must work for different users and conditions.
| Context | Useful question | Design choice |
|---|---|---|
| Baseline | What counts as normal for this asset and window? | Show range, comparison, and version. |
| Quality | Can the value be trusted for this decision? | Expose quality and source state. |
| Scope | Which site, line, asset, or shift is visible? | Make filters and scope persistent. |
| Action | What can this user do next? | Show owner, procedure, and authority. |
Set access and intervention boundaries
Decide whether the first version is observation-only, annotation-enabled, acknowledgement-enabled, or command-capable. Each step adds authority and recovery obligations. Define access by site, asset, role, tenant, and action; do not rely on a hidden control that the server would still accept. A user may need to see a plant-wide trend but only acknowledge an alert for one area. A maintenance lead may add a note but not change a limit. Record the reason for each privileged action and plan how access is reviewed after role, site, or contractor changes.
Specify evidence and service measures
Before building, choose the measures that will reveal whether the dashboard helps. Track data freshness, query latency, stream lag, unavailable assets, failed transformations, alert delivery, access denials, user corrections, and time to acknowledgement. OpenTelemetry can help connect traces, metrics, and logs across ingestion, processing, and presentation. The OWASP Logging Cheat Sheet helps choose events and attributes without logging secrets or unnecessary payloads. Include a correlation identifier in the design so support can follow a displayed value back to its source and processing path.
Example: scope a compressor decision
A plant wants a dashboard for compressor vibration. The team observes that a shift supervisor compares current readings with a seven-day asset baseline, asks a technician to inspect when the deviation persists for ten minutes, and records the decision in a maintenance system. The first version therefore shows asset identity, source time, quality, current value, baseline window, deviation duration, stale state, procedure link, and ownership. It does not add remote control. The acceptance test includes a normal trend, a delayed source, a sensor replacement, a shift handover, and a historian outage. This scope is smaller than a plant overview but much more useful and safer to evaluate.
Plan rollout and change ownership
Choose a representative asset cohort and a named process owner for the pilot. Define what evidence permits expansion: decision time, false alarms, missed events, data-quality complaints, operator corrections, and support burden. Version tag mappings, thresholds, calculations, roles, and alert routing. Establish how a user reports a misleading panel and how the team can roll back a change. NIST’s Cybersecurity Framework provides a useful Identify, Protect, Detect, Respond, and Recover lifecycle for turning the dashboard into an accountable service. Ownership must include data, UI, access, on-call, and process outcomes.
Key takeaways
- Write one decision with an actor, action, consequence, and time horizon.
- Choose authoritative sources and define time, quality, correction, and retention.
- Set freshness and unknown-state behavior before choosing charts.
- Design context, labels, color, focus, and scope for real operating conditions.
- Separate observation from acknowledgement, annotation, and control authority.
- Define service measures, evidence, ownership, pilot cohort, and rollback.
Frequently asked questions
Should the first dashboard include every useful KPI?
No. Start with the smallest set that supports a named decision. Additional measures can be added after the team proves that the first view improves action without creating confusion or alert fatigue.
Can a historian be the only source?
It can be authoritative for historical analysis, but current-state decisions may need a controller or gateway source. Define the authority and time semantics for each field instead of assuming one system owns every truth.
Turn the decision record into a build brief
The build brief should let a designer, data engineer, and operator make the same interpretation of the first release. Include the decision statement, user and asset scope, source authority, field definitions, time semantics, freshness threshold, quality states, baseline calculation, access rules, action link, fallback, and success measures. Add examples of the exact values and labels a user will see for normal, stale, missing, corrected, and out-of-range conditions. This prevents a common failure where the product team agrees on a concept but the implementation quietly changes the meaning through aggregation, rounding, or a default filter.
Select the smallest representative cohort that exposes real variation. One machine with perfect connectivity is not enough if the eventual fleet includes different firmware, gateways, shifts, recipes, and maintenance states. Include a source with delayed data, a source that is manually corrected, and a user who has limited access. Test the decision with the actual procedure and handoff, not only with a clickable mockup. Link to what changes when industrial dashboards move into production before the pilot so service ownership and degraded-mode behavior are accepted alongside the visual design.
Decide what not to build. A first release may deliberately exclude control commands, cross-site comparisons, custom formulas, historical exports, or user-created thresholds. Record why each item is out of scope and what evidence would justify adding it. This protects the initial decision from being diluted by requests that sound useful but add authority, data complexity, or support burden. A narrow dashboard can still provide a clear route for future needs: an owner, an issue record, or a linked procedure. Scope discipline is especially important in OT because a seemingly small display change can affect work timing, escalation, or safety expectations.
Set review gates around meaning, not only code completion. A process owner should approve the decision and fallback; a data owner should approve source and quality semantics; a security owner should approve access and audit; and an operator should approve wording and handoff. Use gateway security guidance when the source path includes edge translation, and IoT telemetry guidance when units, timestamps, or provenance remain unclear. The first build is ready when these roles can agree on evidence, not when the screen merely looks finished.
Ask one difficult question before approving the build: what would a careful operator do if the screen disagreed with a local instrument or a colleague’s report? The answer should name the authoritative source, the escalation path, the evidence to preserve, and the point at which the dashboard must abstain. That answer often changes the design more than a chart preference. It may require a local value beside a historian value, a quality banner above a trend, or a procedure link beside an exception. Use IoT telemetry guidance to inspect units and provenance, and network segmentation guidance when source reachability and trust zones are part of the uncertainty. The build should make disagreement visible instead of smoothing it into one authoritative-looking number.
Leave the team with a clear acceptance sentence: a named user can make a named decision from a value whose source, age, quality, scope, and fallback are visible. If the sentence cannot be tested, the dashboard plan is still too broad. Use industrial dashboards in production to carry the decision into service ownership and IoT telemetry to keep the underlying measurement meaningful.
A strong dashboard brief also names the questions the screen must not answer. If the source cannot support a current conclusion, the view should show uncertainty or direct the user to a different procedure. If the user lacks authority to act, the view should explain the boundary without exposing protected detail. If a metric is exploratory rather than operational, label it accordingly. These decisions prevent a prototype chart from gaining accidental authority simply because it is visually persuasive. They also make later requests easier to evaluate against the original purpose.
Conclusion: decide before you visualize
Industrial dashboards become valuable when they reduce a specific operating ambiguity and make the next safe action clear. Set the decision, sources, freshness, context, access, evidence, and ownership before building the screen. That preparation turns dashboard work from a visualization exercise into a product decision with measurable operational value.