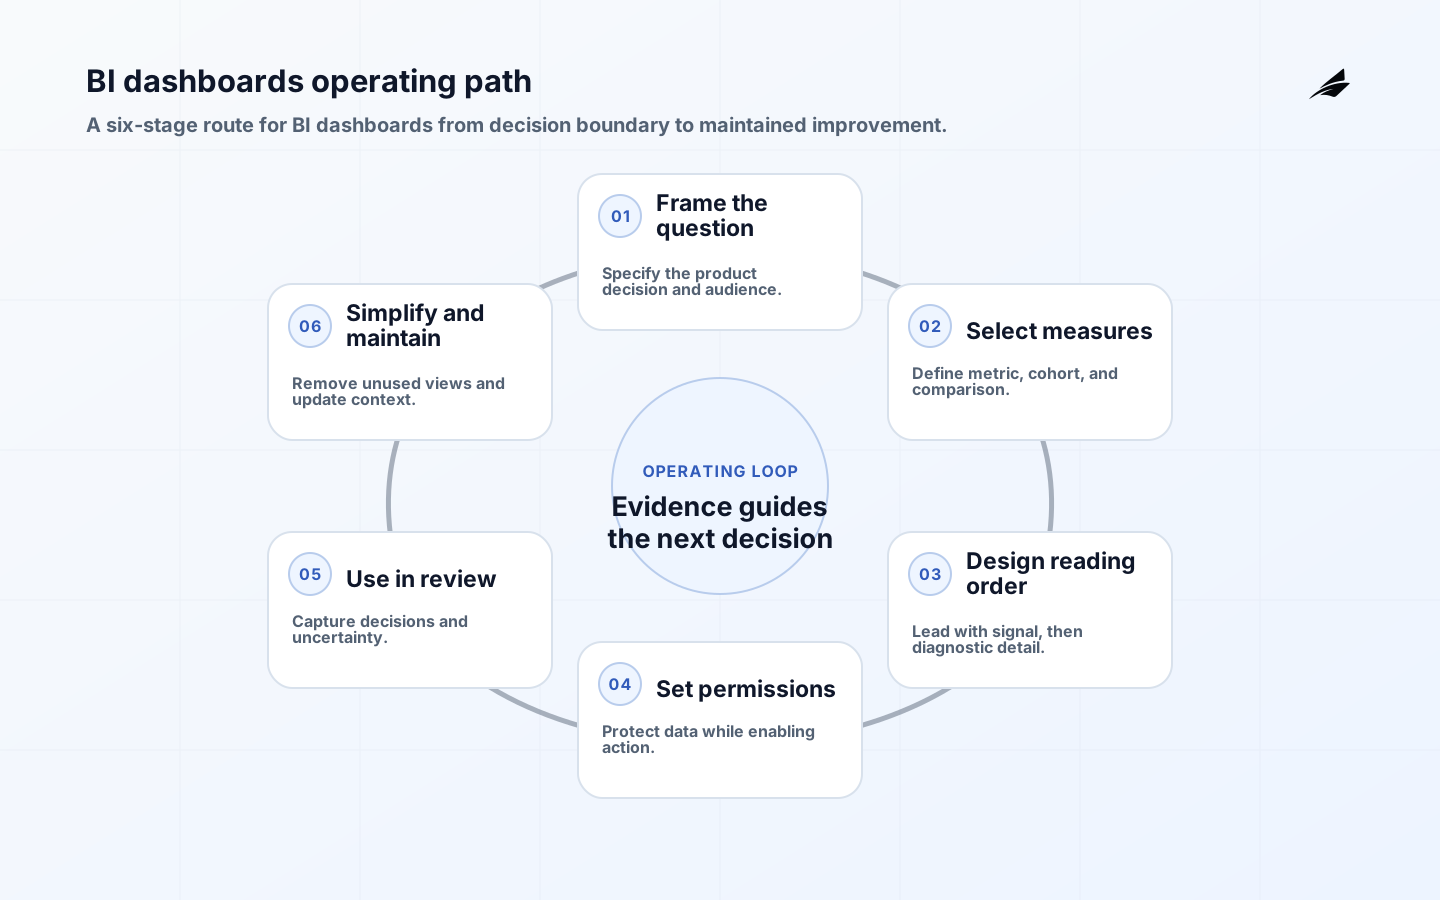
A BI dashboard is not a purchase decision or a document that can be completed once. For product teams, it is a way to turn a product question into a shared, accessible reading and action routine. The useful starting point is a product decision surface: a bounded thing with a named owner, a clear promise to its reader, and evidence for when it should or should not be trusted. WCAG grounds the accessibility obligation, the dbt Semantic Layer documentation supports governed metric reuse, W3C PROV gives provenance a usable model, and NIST SP 800-53 provides control context. A retention dashboard should let a team distinguish a cohort change from an instrumentation gap.
Define a dashboard as a decision surface
Plain language matters because teams often give a BI dashboard a broad label and then make incompatible assumptions about its job. Here, a BI dashboard is a product decision surface designed to serve a known decision or operational need. Its accountable owner is the product manager who convenes the review, supported by the metric steward. Its working inputs are the user question, metric definition, segmentation, permissions, data status, and action threshold. That boundary is deliberately narrower than “all available data”: it gives the team something it can review, test, and improve. It is not a gallery of charts for exploration without an agreed answer to a product decision. The W3C Web Content Accessibility Guidelines provides implementation context, while dbt Semantic Layer documentation helps frame provenance and contract evidence for readers.
- Name the decision, the person who makes it, and the deadline before choosing tools or visuals specifically for retention dashboard evidence.
- Write the unit of analysis and the boundary: what is included, excluded, estimated, or still pending, in the retention dashboard evidence context.
- Give the reader a visible freshness, completeness, or release state rather than implying certainty specifically for retention dashboard evidence.
- Keep an owner and a recovery route beside the definition so questions do not become anonymous support work, in the retention dashboard evidence context.
Make cohorts and comparisons reproducible
A small boundary makes the trade-offs visible. Begin with one audience, one decision cadence, and one source-to-consumer path specifically for retention dashboard evidence. Then ask what can go wrong at each point: a late source, a changed definition, a denied permission, a partial rerun, or an action that is not recorded, in the retention dashboard evidence context. The answer does not need to be elaborate; it needs to be operational specifically for retention dashboard evidence. For BI dashboards, the essential components are a primary question, ordered measures, comparison context, permissions, and accessible interaction. A team should be able to point to the owner for each component and show where its current state is recorded, in the retention dashboard evidence context. That is more useful than declaring a platform “trusted” without a way to inspect its behavior specifically for retention dashboard evidence.
| Boundary question | Concrete answer to record | Why it changes decisions |
|---|---|---|
| Reader and action | Which product team member uses a BI dashboard, and what action follows? | Prevents a general-purpose artifact from becoming an unowned report. |
| Meaning and grain | What does one record, value, or result represent? | Stops apparently similar totals from being compared as if they were equivalent specifically for retention dashboard evidence. |
| Timing promise | What cut-off, lateness window, or release cadence applies? | Lets readers distinguish current signals from settled results. |
| Failure route | Who investigates an unexpected, late, or unavailable result? | Turns uncertainty into a controlled operational response. |
The executive dashboards operations playbook adds an operating view, while the semantic layers planning guide and founders’ dbt models guide show why a dashboard needs stable definitions and maintainable upstream models.
Design access, semantics, and provenance together
Design choices should make correct use easier than accidental misuse. Put scope and status close to the result, then offer detail only where it supports investigation specifically for retention dashboard evidence. Separate business meaning from implementation mechanics but connect them through stable identifiers and links, in the retention dashboard evidence context. This is especially important when the same output reaches different teams or tools specifically for retention dashboard evidence. The W3C PROV overview is a useful reference for recording lineage and operational context; the NIST SP 800-53 Rev. 5 provides a control-oriented lens for access, change, and recovery. Neither replaces local decisions about who may use the result and what evidence they need specifically for retention dashboard evidence. For BI dashboards, the W3C PROV overview helps readers trace important results, while NIST SP 800-53 Rev. 5 informs access and change controls.

- Make the default view answer one named question; use drill-down for diagnosis rather than placing every field on the first screen, in the retention dashboard evidence context.
- Expose source or model status where a reader can see it before acting on an incomplete result specifically for retention dashboard evidence.
- Treat identifiers, classifications, and access rules as part of the design, not post-launch administration, in the retention dashboard evidence context.
- Keep release notes short and decision-focused: what changed, when it takes effect, who is affected, and where to ask questions, in the retention dashboard evidence context.
| Design choice | Good operational behavior | Failure it avoids |
|---|---|---|
| Explicit status | Show the stated timing promise for a product decision surface. | A reader mistakes an in-progress result for a final one. |
| Named ownership | Display or link to the product manager who convenes the review and the metric steward. | A question waits while teams debate who should respond. |
| Traceable change | Link release, source, or transformation evidence. | A changed number becomes impossible to explain after the fact. |
| Proportionate access | Give each role only the detail required for its decision. | Sensitive data spreads through convenient exports or broad workspaces. |
Implement a small workflow before adding scope
A dashboard implementation should first prove that a real reader can make the intended decision. Build the smallest path from source to meeting-ready result, then test a normal refresh, a late event feed, a changed definition, and a permission failure. Ask a non-builder to state the cohort, cutoff, interpretation, and next action without private context. Keep the fixtures and expected outcomes for future reviews. A successful pipeline run is not enough: acceptance must cover data state, timing, access, documentation, and the reader’s ability to act.
Operate when instrumentation or data is imperfect
After release, use real operating evidence to decide what deserves improvement. Reassess the dashboard when product instrumentation, user roles, or planning cadence changes. Record incidents in terms readers can understand: which product decision was affected, what promise was missed, what scope changed, and how the result was corrected. Pair that record with technical signals such as freshness, job state, contract violations, test results, or access events, in the retention dashboard evidence context. The point is to help the responsible person see risk early and choose an appropriate response, not to create an endless dashboard about dashboards.
During a product review, reserve a minute to state what the dashboard cannot establish. A cohort chart may show a change but not its cause; an instrumentation alert may make a trend provisional. Naming that limit protects the team from confident storytelling and directs the next investigation. It also gives designers a reason to include diagnostic paths rather than filling the screen with unrelated secondary metrics.
Scenario: retention falls after an event-schema change
A retention dashboard can mislead a product team when it mixes cohort definitions with current activity. State whether a cohort is formed at signup, first activation, or first paid use, then keep that rule stable for the comparison window. If activation instrumentation changed during the period, show the affected date and qualify the result rather than presenting a clean trend. The reader should be able to distinguish a real change in returning users from a missing event or a new eligibility rule.
Make the review actionable by pairing the retention measure with a diagnostic path: cohort size, activation completion, platform or region, and the event coverage check. Give the product manager authority to decide whether to investigate onboarding, annotate the result, or pause a conclusion. Preserve the definition version and the source-status record with the meeting decision. This is first-principles dashboard design in practice: the page does not promise to explain causality, but it makes the evidence, limits, and next responsible action visible.
Key Takeaways
- BI dashboards earn trust through a clear decision boundary, not through volume or visual polish.
- A named owner, visible timing promise, and tested failure route make the output usable when conditions change, in the retention dashboard evidence context.
- Test accepted examples and degraded paths before scaling to more teams, consumers, or source systems, in the retention dashboard evidence context.
- Treat every material definition or access change as a release that affected readers can understand specifically for retention dashboard evidence.
Reference checkpoints for retention dashboard evidence: Use W3C Web Content Accessibility Guidelines to check retention dashboard evidence at definition time. Use dbt Semantic Layer documentation to check retention dashboard evidence at release time. Use W3C PROV overview to check retention dashboard evidence at review time. Use NIST SP 800-53 Rev. 5 to check retention dashboard evidence at exception time.
Frequently Asked Questions
Use these questions to test a retention dashboard as a decision surface rather than a decorative report.
Conclusion
The durable version of BI dashboards is a maintained agreement between people, data, and a decision. Start with the narrowest valuable use, make its meaning and timing visible, give it an owner, and rehearse how it behaves when the inputs are imperfect, in the retention dashboard evidence context. That approach creates useful evidence for expansion without claiming certainty that the system cannot provide, in the retention dashboard evidence context. As the workflow grows, preserve the decision boundary and let each material change earn trust again specifically for retention dashboard evidence.
For BI dashboards at first principles, the durable unit is a decision surface with a stable cohort, visible comparison, accessible interpretation, and explicit limits. Start small, retain the evidence behind the view, and make each expansion prove that it still serves the product workflow.
Review retention after an event-schema change removes a portion of activation events. The dashboard should mark the affected cohort, pause an unsafe comparison, and preserve the definition used before and after the change. The product team can then investigate the instrumentation gap without mistaking a measurement break for user behaviour.