What Changes When Industrial Dashboards Move into Production
Industrial dashboards in production carry a higher duty than prototype charts. An industrial dashboard can be attractive and still be unsafe to operate. In a prototype, a chart proves that data can be collected. In production, the dashboard becomes part of a work decision: an operator decides whether to investigate, slow a line, dispatch maintenance, or accept a normal condition. That raises the standard for freshness, units, alarm meaning, permissions, availability, accessibility, and evidence. The dashboard must show what is known, what is uncertain, who owns the next action, and what to do when the data path fails. NIST’s Guide to Operational Technology Security is a useful context because OT systems have safety, timing, and availability constraints that a generic analytics screen may hide.
Anchor the screen to an operating decision
Start by naming the user, decision, time window, and consequence. “Monitor the line” does not tell a designer what the screen must enable. “Help the shift lead decide whether a pump deviation needs an immediate inspection” does. The screen then needs a current value, unit, baseline, quality state, last-good time, related asset, and an action path. Link to industrial dashboards decisions that matter before the first build when scoping a new surface. A production dashboard should have a deliberately small first decision set instead of becoming a wall of every available tag.
| Production question | Required behavior | Evidence |
|---|---|---|
| Is the value current? | Show source time, receipt time, and stale state. | Freshness test and data-quality event. |
| Can the operator interpret it? | Show unit, range, baseline, and context. | Reviewed decision example with operator. |
| What happens next? | Expose owner, procedure, and escalation. | Action record and handoff outcome. |
| What if data fails? | Make uncertainty visible and give a fallback. | Disconnected or stale-data drill. |
Make data lineage visible
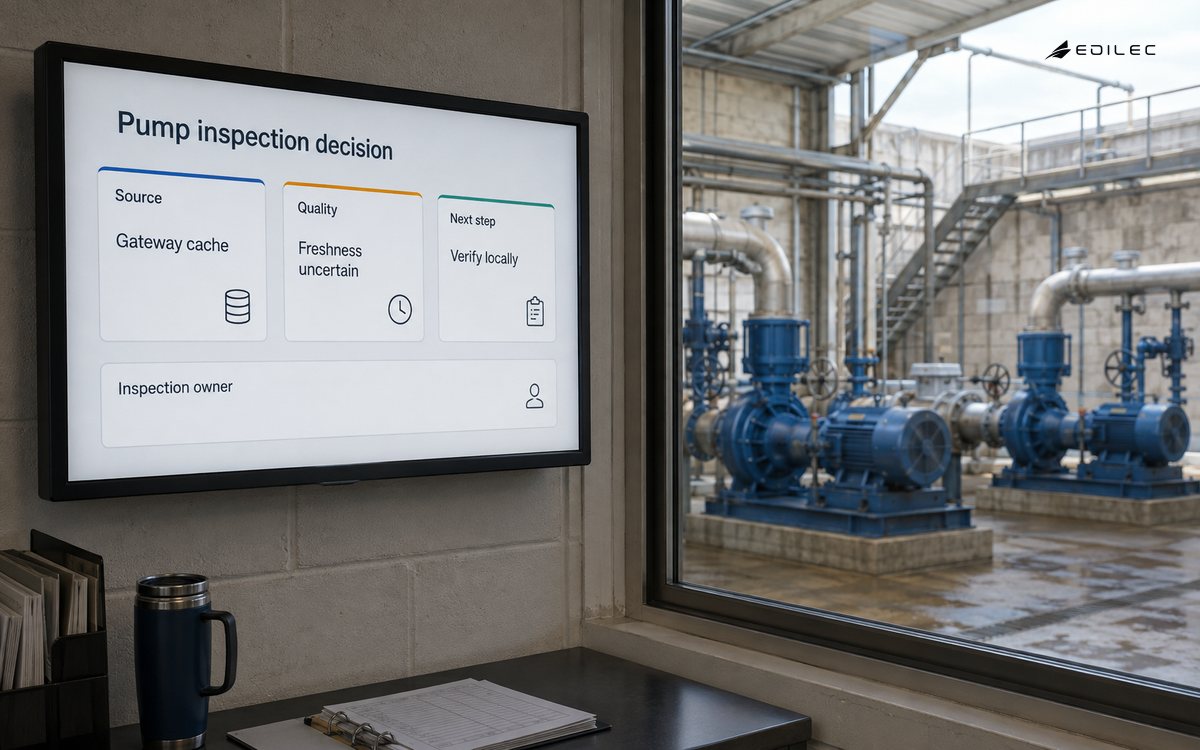
Production users should not have to guess whether a value came from a live sensor, a gateway cache, a historian, or a manually corrected record. Show source, timestamp semantics, quality flag, aggregation window, and last successful update where they affect the decision. A large number without provenance can be more dangerous than a blank panel because it invites false certainty. Preserve the underlying event or query reference so support can investigate a disputed reading. If the dashboard computes a rate, average, or threshold, document the calculation near the view and version it when the business meaning changes.
Separate condition, urgency, and acknowledgement
A production dashboard should not turn every threshold crossing into the same visual alarm. Distinguish a measured condition from the urgency assigned to it, and distinguish an acknowledged alert from a resolved condition. Record who acknowledged, when, why, and what action followed. Avoid color as the only signal; WCAG 2.2 includes requirements around use of color, contrast, keyboard access, focus, labels, and meaningful sequence that matter in a control room as well as a web app. Make the wording usable in low light, on a small display, and during a handover.
Design for outages and degraded data
When a data source, network, identity provider, or dashboard service fails, the screen should explain the boundary of uncertainty. A frozen chart that looks current is a dangerous failure mode. Show stale status, last-good time, missing assets, delayed streams, and the approved fallback procedure. Decide which views may use cached data and how clearly cache age is shown. In an OT setting, a dashboard outage must not remove a local safety function or imply that a remote view is authoritative for control. Test sensor loss, historian delay, partial gateway failure, authentication outage, and a service restart during a shift.
| Failure mode | Dashboard state | Operator guidance |
|---|---|---|
| Sensor stops | Show stale value, last-good time, and affected asset. | Inspect locally or use approved manual check. |
| Network partitions | Separate local, cached, and unavailable data. | Follow site continuity procedure. |
| Calculation changes | Show metric version or effective time. | Compare old and new interpretation. |
| User lacks access | Explain scope without leaking protected values. | Contact named owner or use approved role. |
Operate the dashboard as a service
Measure the dashboard’s own reliability as well as the plant values it displays. Track page and query latency, data freshness, stream lag, failed transformations, unavailable assets, permission denials, alert delivery, and operator corrections. OpenTelemetry documentation provides a common way to connect traces, metrics, and logs across services; use correlation identifiers so a user-visible stale panel can be traced to a source or processing failure. The OWASP Logging Cheat Sheet is useful for deciding which events and attributes support operations without recording secrets or unnecessary process data.
Control access and change authority
A dashboard may be read-only, or it may let an operator acknowledge, annotate, silence, configure, or issue a command. Treat those as different authorities. Apply least privilege to sites, assets, views, and actions, and make the server enforce the boundary rather than relying on hidden buttons. A user who can see a plant-wide overview may not be allowed to change a limit. Record sensitive actions with actor, target, old value, new value, reason, and result. Tie access changes to the operating owner and review exceptions after maintenance or role changes.
Example: put a pump dashboard into service
A prototype shows vibration, temperature, and flow for one pump. Before production, the team defines the shift lead’s decision: investigate a deviation before it becomes a stoppage. The dashboard adds units, source time, quality, baseline window, asset identity, and a visible stale state. The alert distinguishes a threshold crossing from acknowledgement and links to the maintenance procedure. A local operator can continue using site controls if the remote dashboard is unavailable. The service records the user, view, alert, annotation, and export actions; it also measures query latency and the time between a sensor event and display. Only after a stale-data drill and a handover review does the team widen the fleet.
Make change management part of the product
Changes to tag mappings, thresholds, calculations, layout, roles, and alert routing can alter an operating decision. Version them, name the owner, record effective time, and provide a way to compare behavior before and after the change. Use a test dataset that includes normal, missing, delayed, outlier, and corrected values. For high-consequence controls, require a review from the process owner and a rollback plan. NIST’s Cybersecurity Framework offers a useful lifecycle for identifying assets, protecting changes, detecting drift, responding to unexpected behavior, and recovering to a known-good configuration. Production readiness is a continuing discipline, not a launch checkbox.
Key takeaways
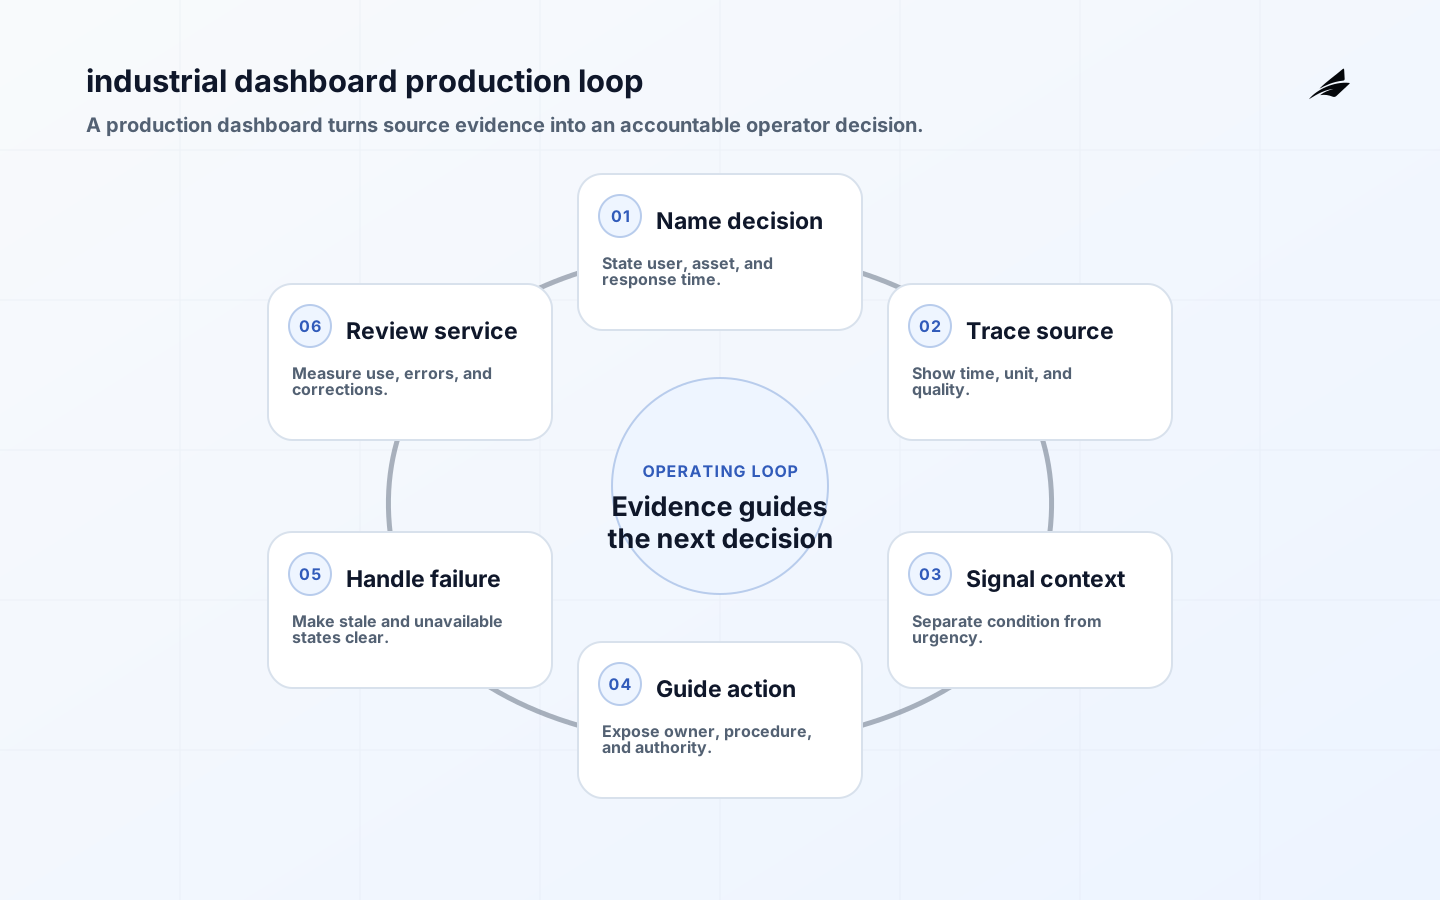
- Support a named decision for a named operating role.
- Show source, time, unit, quality, context, and stale state.
- Separate condition, urgency, acknowledgement, and resolution.
- Provide an approved fallback for unavailable or delayed data.
- Measure its own latency, freshness, errors, access, and corrections.
- Version calculations, mappings, permissions, and alert behavior.
Frequently asked questions
Should a dashboard issue control commands?
Only when the command authority, safety boundary, confirmation, audit record, timeout, and local fallback are designed explicitly. Observation and intervention should not share an implicit permission model.
Is cached data acceptable in production?
It can be, when the use case tolerates it and the dashboard makes cache age and uncertainty unmistakable. Never present old data as a live condition.
Create a production handover that operators can use
The production handover for an industrial dashboard should be an operating reference, not a screenshot pack. State the decisions supported, source systems, freshness rules, calculations, permissions, escalation paths, fallback procedure, on-call owner, and known limitations. Include a small set of realistic examples: a normal shift, a stale sensor, a delayed historian, an acknowledged alert, and a corrected reading. Give the shift team a way to report a misleading state and a clear expectation for response. The handover is complete only when an operator can explain what the screen means and what it does not mean.
Run a production-readiness drill with the people who will use the dashboard during a difficult shift. Disconnect one source, delay a stream, expire a session, restart a processing worker, and introduce a calculation version change. Ask the operator to identify uncertainty, choose the fallback, record an action, and hand over the condition. Measure not only whether the service returns but whether the user makes the right decision with the available evidence. Use industrial dashboard planning guidance to compare the live surface with the original decision contract.
Keep the visual hierarchy aligned with consequence. The most urgent condition should be distinguishable from a low-priority trend, but the display should not create alarm fatigue by treating every deviation as an emergency. Show the asset and scope in every detail view, preserve units and source age, and keep the action or procedure nearby. Keyboard operation, visible focus, readable contrast, and non-color cues matter when a user is switching between panels or working in a noisy environment. OpenTelemetry documentation can help connect a stale screen to the ingestion and processing path rather than leaving support to inspect each service separately.
Review the dashboard as a product after launch. Compare intended and observed use, track corrections and workarounds, and investigate when operators export data to a private spreadsheet or ignore repeated alerts. Those behaviors may show a missing context field, an unreliable source, an access constraint, or a procedure that no longer matches the process. Version the change, test it with representative shift data, and communicate the effective time. A production dashboard earns trust through small, explainable improvements that make decisions easier without hiding uncertainty.
Give the dashboard a clear release owner for every layer: source mapping, calculation, presentation, access, alerting, and operating procedure. When a tag is renamed or a historian changes its semantics, the owner should know whether the visual, threshold, or runbook must change. Keep a small release note that states the effective time and the user-visible consequence. During handover, ask an operator to trace one displayed condition to the source, interpret its quality, choose an action, and find the resulting record. If that trace breaks, the dashboard may be technically available but operationally incomplete. Link the review back to industrial dashboard planning and gateway security when data or edge behavior changes. This kind of traceability is what keeps a production view trustworthy after the original builders move on.
Do not forget the human handover. Define what a shift lead should say when the dashboard is stale, who owns a data-quality problem, how a correction is recorded, and how the next shift learns about an unresolved condition. A dashboard can be technically observable and still fail the handover if its status language does not match the process vocabulary. Pair the production review with industrial dashboard planning so the original decision and the live service remain connected.
Treat source changes as production changes even when the dashboard code is untouched. A gateway firmware update, protocol migration, historian retention change, or identity-policy change can alter freshness and meaning. Coordinate the review with protocol selection and gateway security so the data path, authority, and fallback remain aligned. Record the effective time and give operators a short explanation of what they may notice.
Conclusion: production means accountable decisions
Moving an industrial dashboard into production means taking responsibility for the decisions it shapes. Data lineage, accessible interaction, explicit uncertainty, service observability, access control, and recovery must be part of the design. When the screen tells operators what is known and what to do next, it becomes a dependable operational surface instead of a polished chart gallery.