A cloud cost optimization dashboard should help someone make and follow through on a decision. It should identify who owns spend, explain why cost changed, distinguish usage from rate effects, show whether an optimization is safe, and track whether the expected benefit was realized. A collection of provider charts can display spend without creating that operating capability.
This guide is for finance, engineering, product and FinOps teams defining a custom dashboard or data product. It covers source data, normalization, allocation, persona views, metrics, risks, effort and rollout. For a conceptual companion, see Cloud Cost Optimization: From Usage to Architecture.
What the dashboard must answer
The first design artifact should be a decision inventory, not a mockup. Executives need trend, forecast, material variance and value. Finance needs invoice reconciliation, accrual-friendly views, commitments and accountable budgets. Product leaders need cost per product or customer outcome. Engineers need resource-level drivers and safe actions. FinOps practitioners need data quality, allocation coverage, anomaly workflow, commitment performance and realized savings. One page cannot serve all of these well, so define a shared cost model with role-specific views.
| Persona | Decision | Minimum view | Drill-down |
|---|---|---|---|
| Leadership | Are technology investments within plan and producing value? | Actual, forecast, variance and unit-cost trend | Business unit, product and major change driver |
| Finance | What should be accrued, allocated or explained? | Invoice-aligned billed cost, amortized cost and forecast | Billing account, charge category, credit, adjustment and owner |
| Engineering | What can we change without harming reliability? | Service cost, utilization context, anomalies and open actions | Resource, environment, region, SKU and deployment change |
| Product | How does cost scale with demand and margin? | Cost per transaction, tenant, active user or workload unit | Feature, customer segment and demand driver |
| FinOps | Where is ownership or optimization flow breaking down? | Allocation coverage, forecast variance, commitments and action register | Rule version, source freshness, assignee, due date and realized outcome |
Treat the dashboard as a FinOps product
The FinOps Framework describes a collaborative practice across engineering, finance, leadership, procurement and product. That matters because the dashboard cannot fix unclear accountability. Establish a product owner for the cost data, a finance owner for accounting interpretation, engineering owners for allocated scopes and a governance group for shared-cost and metric definitions. Every alert or recommendation needs an action path: assignee, due date, decision, expected effect, validation window and final outcome.
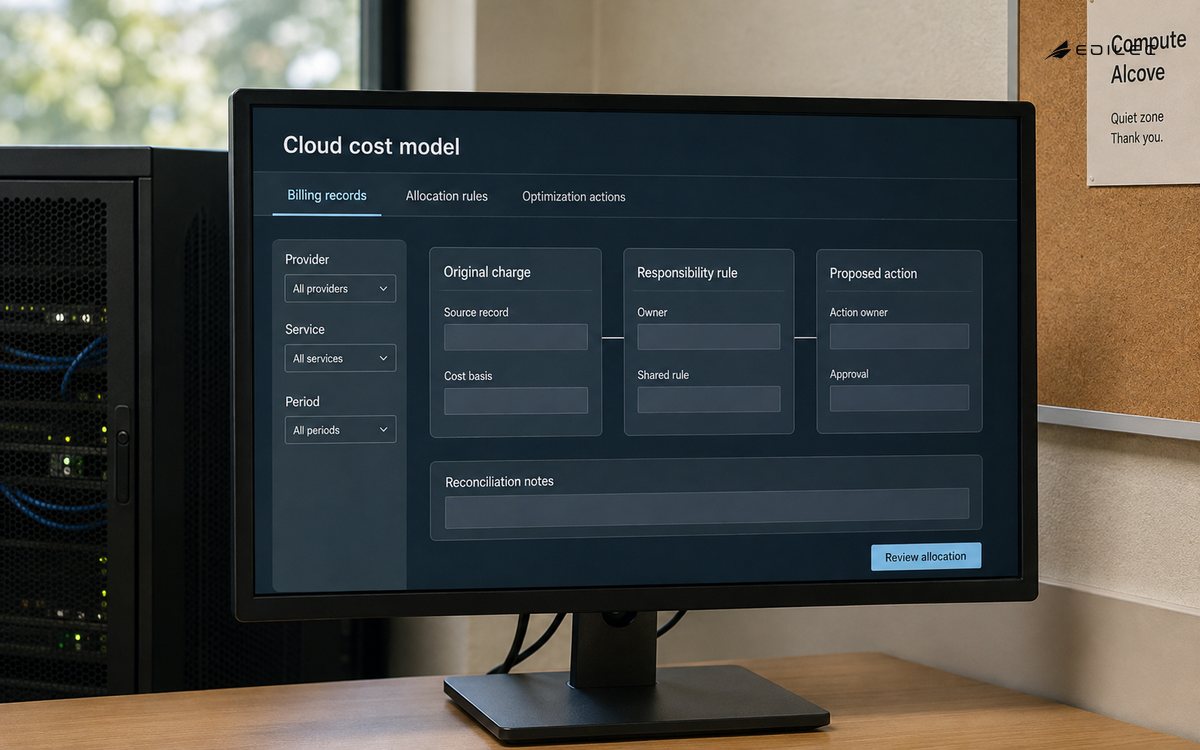
Separate three records that are often collapsed. The billing record states what a provider charged. The allocation record maps cost to organizational responsibility using accounts, projects, subscriptions, tags and explicit shared-cost rules. The optimization record captures a proposed action and its result. Preserving these layers makes reports explainable and allows allocation policy to evolve without rewriting original billing facts.
Build on detailed billing exports
Use provider-supported recurring exports as the system input, then retain immutable raw snapshots before transformation. AWS Data Exports identifies CUR 2.0 as its recommended detailed format and also offers a FOCUS export. Azure Cost Management supports recurring exports for actual, amortized and FOCUS-formatted cost and usage data, subject to account and scope limitations. Google Cloud's detailed BigQuery export includes resource-level fields, while its documentation warns that schemas can evolve and recommends normalized views to protect downstream queries.
| Layer | Purpose | Key controls | Quality check |
|---|---|---|---|
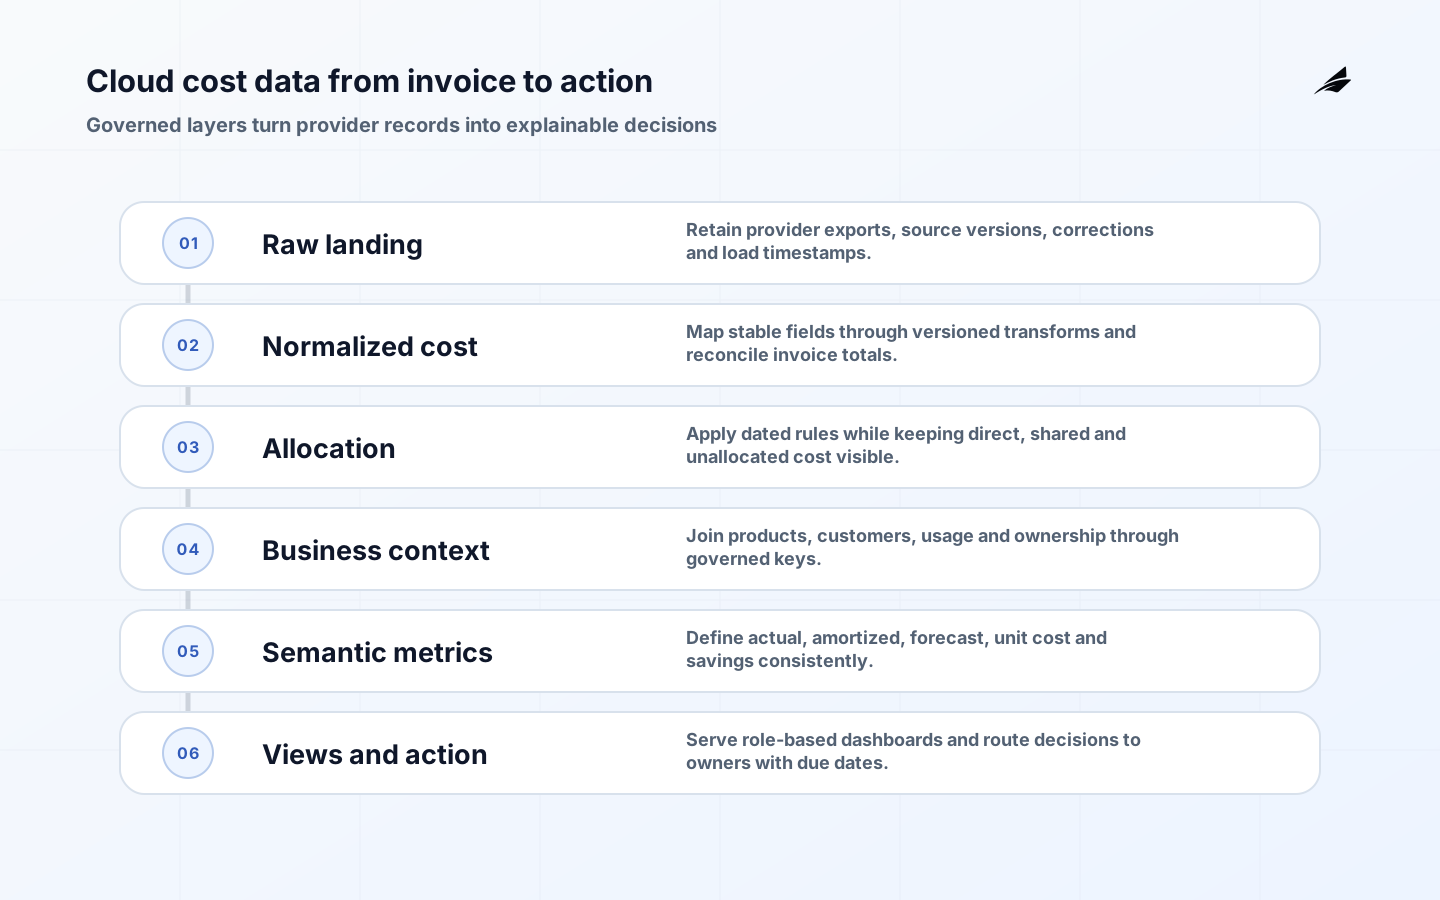
| Raw landing | Preserve provider records and corrections | Restricted storage, source metadata, load timestamp and immutable partitions | Expected file or table arrived; row and amount checks are recorded |
| Normalized cost | Create stable provider-neutral fields | Versioned transformations and explicit FOCUS version mapping | Provider totals reconcile within documented rounding rules |
| Allocation | Assign direct and shared cost to accountable scopes | Versioned rules, effective dates, exception queue and owner directory | Allocated plus unallocated totals equal normalized totals |
| Business context | Join product, customer, usage and organizational data | Documented keys, data contracts and privacy classification | Join coverage and duplicate-rate thresholds pass |
| Semantic metrics | Define actual, amortized, forecast, unit cost and savings consistently | Metric catalog, owner, grain, currency and refresh policy | Known scenarios reproduce independently reviewed results |
| Presentation and action | Serve persona views, alerts and optimization workflow | Role-based access, freshness indicator and export controls | A user can trace a headline number to source and rule version |
Make allocation policy explicit
Allocation starts with stable hierarchy before resource tags. Map billing accounts, subscriptions and projects to a product, business unit or cost center wherever possible. Use tags and labels for finer responsibility, but account for their effective dates and service-specific coverage. Google Cloud notes that cost for a label appears only from the time that label was applied; a dashboard must not imply that a newly added label retroactively classified earlier usage.
Define shared costs by category: network hubs, observability platforms, support plans, security tools, Kubernetes control planes and central data services may need different rules. Valid choices include central funding, equal split, proportional spend or a usage proxy. Publish the rationale, effective date and owner. Show direct, shared and unallocated cost separately so users can distinguish resource behavior from allocation policy. For Kubernetes, OpenCost provides a useful model that separates workload, idle and cluster overhead costs rather than pretending every charge maps directly to a pod.
Choose metrics that preserve meaning
- Billed cost for invoice and cash accountability; keep it distinct from effective or amortized views.
- Amortized or effective cost for services consuming commitment benefits over time.
- Forecast and variance with the forecast version, horizon and assumptions visible.
- Allocation coverage, including direct, shared-by-rule and unallocated proportions.
- Commitment coverage and utilization, separated so buying more discount is not confused with reducing usage.
- Unit cost using a business denominator such as successful orders, active tenants, processed records or model inferences.
- Anomaly impact with owner, status, root cause and resolution, not just a colored spike.
- Realized optimization benefit measured against a stated baseline after implementation, net of demand or pricing changes where feasible.
A unit metric requires a contract. Define numerator, denominator, grain, exclusions, currency, time zone, late-data behavior and owner. Cost per order can fall because infrastructure improved, because low-value orders increased, or because a credit arrived. Pair unit cost with volume, quality and reliability so the business does not optimize the ratio by degrading the product. The dashboard should make causal confidence visible: observed correlation, engineering estimate and finance-validated result are not equivalent claims.
Design for scan, explain and act
A useful top-level page can follow three layers. Scan shows current period actual, forecast, material variance, allocation coverage and data freshness. Explain shows ranked cost drivers, demand context, rate or commitment effects and changes in ownership. Act shows anomalies, recommendations and decisions with owners and due dates. Every number should expose definition and drill-through. Default filters must state whether they use usage date or invoice period, actual or amortized cost, and which currency conversion policy applies.
Avoid a single red-versus-green savings score. Cost can rise for healthy reasons such as more customers, stronger resilience or a planned migration. Optimization means improving value, not minimizing the bill in isolation. Include reliability and capacity context for rightsizing candidates, and require an engineering decision before automated shutdown outside well-defined ephemeral environments. The Observability Dashboards guide provides complementary guidance for operational signals.
Deliver the dashboard in controlled increments
- Frame decisions: interview each persona and document the decisions, cadence and action owner the first release must support.
- Prove one source: ingest a single billing scope, preserve raw data, reconcile one invoice period and expose freshness and correction handling.
- Establish ownership: map hierarchy, publish required metadata and create an unallocated-cost workflow before pursuing perfect tagging.
- Release minimum views: actual versus plan, top drivers, owner drill-down and data-quality indicators are more valuable than dozens of charts.
- Add optimization workflow: connect anomalies and recommendations to tickets or an action register, then measure outcomes after implementation.
- Expand context: add commitments, forecasts, Kubernetes allocation and business-unit denominators only when their definitions and owners are ready.
- Operationalize: monitor pipeline freshness, reconciliation, schema drift, access, query cost and dashboard usage; review metric definitions on a fixed cadence.
Estimate implementation effort
Dashboard effort is dominated by data and governance, not chart construction. Estimate each provider and billing agreement separately because export availability, scope and history differ. Add work for normalization, currency, commitments, invoice reconciliation, late corrections, allocation hierarchy, shared-cost policy, business-data joins, role-based access and action integrations. A multi-cloud dashboard is not three copies of the same connector; it is a common semantic layer over different billing behaviors.
| Complexity signal | Lower effort condition | Higher effort condition |
|---|---|---|
| Provider estate | One billing agreement and supported recurring export | Multiple providers, resellers, agreements or currencies |
| Ownership | Stable account hierarchy mapped to products | Frequent reorganization, weak metadata and disputed shared costs |
| Financial interpretation | One agreed actual-cost view | Invoice, amortized, commitment, tax and accrual requirements |
| Business context | One reliable usage denominator with a stable key | Customer or product joins across inconsistent operational systems |
| Workflow | Read-only reporting with monthly review | Near-daily anomaly triage, approvals, ticketing and realized-benefit tracking |
| Access | Common visibility across teams | Contractual rate sensitivity, customer isolation or restricted cost centers |
Use acceptance gates instead of an unsupported fixed schedule. The data foundation is ready when one complete period reconciles and corrections behave as designed. Allocation is ready when the published rules reproduce totals and unallocated cost has an owner. A persona view is ready when target users can answer a real decision and trace the result. Automation is ready when failure, stale data and authorization paths are tested.
Example: explain a sudden platform increase
Suppose shared Kubernetes cost rises after a product launch. The executive view shows the increase against forecast and the change in cost per successful transaction. The engineering view separates nodes, storage, network, idle capacity and cluster overhead using billing data plus Kubernetes allocation. A deployment annotation shows when a new workload entered production. The action register records whether the team will tune requests, adjust autoscaling or retain capacity for a reliability reason. After the change, the dashboard compares actual cost and service health with the agreed baseline.
This chain is stronger than a generic rightsizing recommendation because it preserves demand, ownership, technical safety and outcome. It also makes an explicit decision to retain headroom visible rather than repeatedly flagging the same capacity as waste. Teams planning deeper cost governance can use Cloud Cost Visibility: A Practical Guide for Founders as an adjacent resource.
Risks and reporting traps
- Fresh-looking stale data: show source freshness, load status and known provider latency beside the metric.
- Invoice mismatch: preserve invoice-period views and adjustments instead of expecting usage-date reports to equal the bill.
- Schema drift: land raw data, normalize through versioned views and test expected columns and totals.
- False allocation precision: label direct, rule-based shared and unallocated cost rather than hiding assumptions.
- Savings double counting: give each action an identity, baseline, owner and validation window; distinguish projected from realized benefit.
- Unsafe optimization: pair resource recommendations with utilization, service ownership, SLOs and rollback constraints.
- Dashboard abandonment: embed decisions into budget, architecture, incident and engineering review cadences instead of relying on passive visits.
Key takeaways
- Start with decisions and owners, then design persona views.
- Preserve raw billing facts and separate normalization, allocation and optimization records.
- Use FOCUS as a versioned common model while respecting provider-specific export versions and extensions.
- Show actual, amortized, forecast, unit and allocation metrics with explicit definitions.
- Turn anomalies and recommendations into owned actions with measured outcomes.
- Treat data quality, schema drift, access and reconciliation as production responsibilities.
Frequently asked questions
Do we need a custom dashboard if the cloud provider has one? Not always. Provider tools are often enough for a single-cloud team with straightforward ownership. A custom layer becomes useful when decisions require multi-provider normalization, business metrics, shared-cost policy, tailored access or workflow integration.
What is FOCUS? The FinOps Open Cost and Usage Specification is a provider-neutral billing data specification. Version 1.4 is the current published release at research time. Provider export support may be on an earlier version, so record and transform versions explicitly.
Should a dashboard use billed or amortized cost? Use both for different decisions. Billed cost supports invoice accountability. Amortized or effective cost distributes commitment economics to the periods and services that consume the benefit. Label the selected view clearly.
How should shared cloud costs be allocated? Choose a policy per cost category: central funding, equal split, proportional cost or a usage proxy. Publish the rationale, owner and effective date, and keep direct and shared amounts separately visible.
Can the dashboard automate shutdown or rightsizing? Automate only within explicit guardrails and proven rollback paths. Production changes require service ownership, reliability context and change controls. Start with recommendations and low-risk ephemeral resources before broader automation.
How do we prove savings? Register the action before implementation with a baseline, expected mechanism and validation window. Compare the outcome while accounting for demand, pricing and architecture changes, and keep projected, observed and finance-validated values distinct.
Conclusion
A decision-ready cloud cost dashboard is a governed data product and an operating workflow. It reconciles trustworthy billing records, makes allocation assumptions visible, connects spend to demand and routes opportunities to accountable owners. Deliver one reconciled scope and one real decision first, then expand providers, metrics and automation as the organization proves it can act on the information safely.