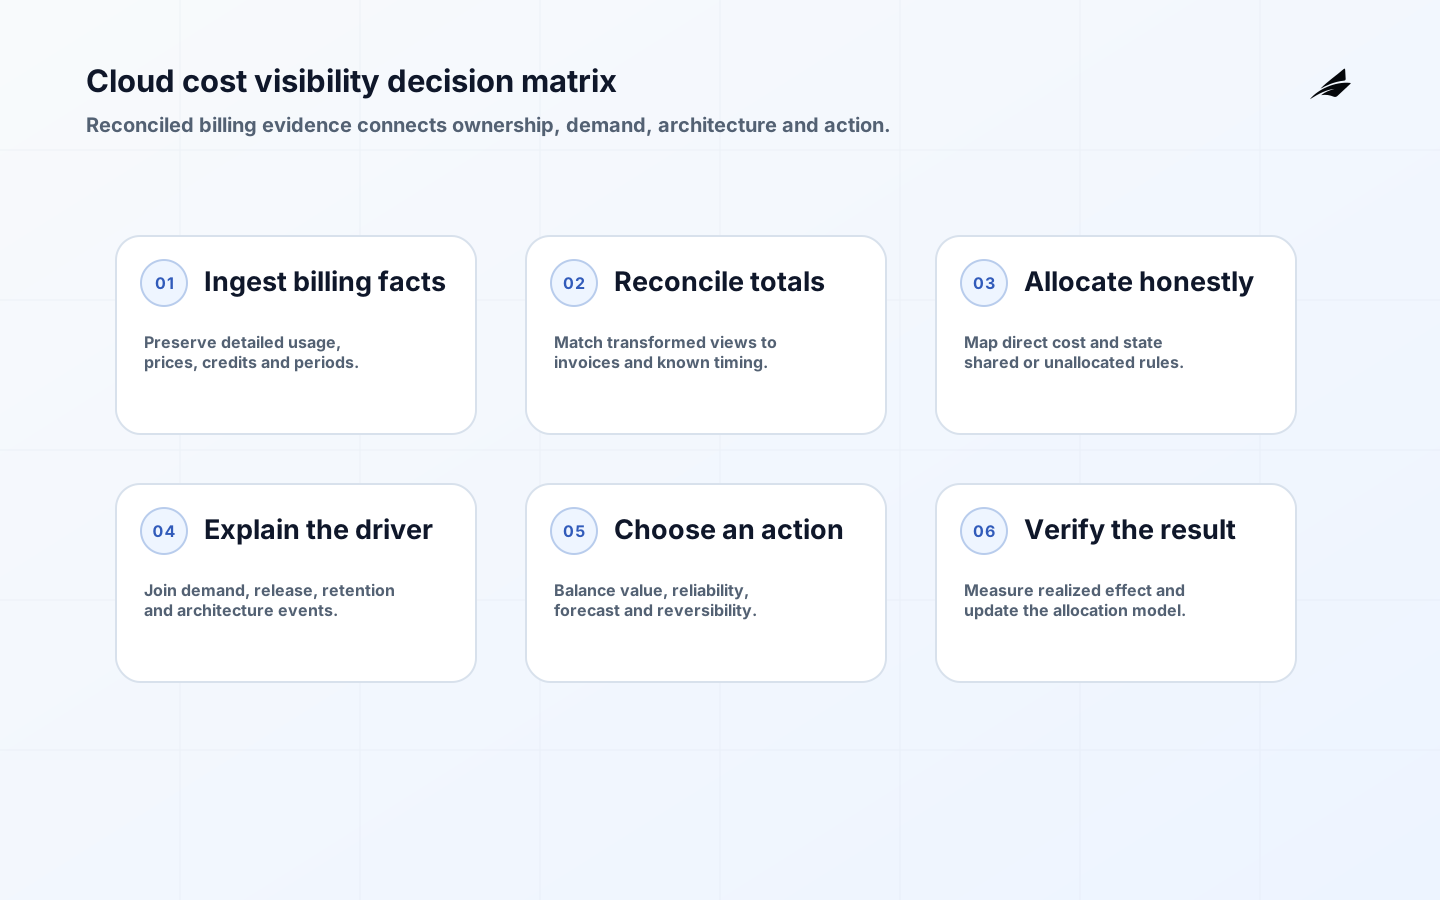
Cloud cost visibility is the ability to explain what the organization spent, which product or capability consumed it, what business or technical driver changed, and who can act. A monthly provider total cannot answer those questions. Product teams need a stable cost data pipeline, an allocation model that admits uncertainty, and a review rhythm connected to architecture, reliability, pricing, and demand. The goal is not to make every shared rupee or dollar look exact. It is to give decision-makers a sufficiently complete and timely economic view to choose deliberately.
Connect this operating model to Edilec’s cloud cost optimization guide, managed cloud architecture guide, and cloud monitoring guide. Cost, architecture, and reliability need a shared account of the same services.
Define the cloud cost visibility operating model
The FinOps Framework describes a collaborative practice in which engineering, finance, and business stakeholders work together to maximize the value of technology. Translate that principle into named decisions. Finance owns invoice reconciliation and accounting treatment; platform teams own billing-data ingestion and shared-service rules; product owners explain demand and value; engineering owners can change architecture and capacity. A cost analyst may facilitate, but should not become the sole owner of every optimization decision.
| Question | Required evidence | Typical owner |
|---|---|---|
| Where did spend change? | Billed cost by service, account, region, and day | FinOps or cloud finance |
| Why did it change? | Usage driver, release, traffic, retention, or price change | Engineering owner |
| Who benefits? | Product, customer, team, or shared capability mapping | Product and finance owners |
| What action is safe? | Reliability target, commitment, growth forecast, reversibility | Architecture and product owners |
Treat billing data as a governed data product
Ingest detailed billing exports into an immutable raw layer, preserve provider identifiers and invoice periods, and create tested transformations for amortization, credits, discounts, currency, taxes, and effective cost. Reconcile reporting totals to the provider invoice before asking teams to act. Make late adjustments visible rather than rewriting history silently. Publish the data’s freshness and known coverage gaps. Cloud billing is often delayed and provider-specific, so a daily operating view and a final accounting view may legitimately differ; label them clearly.
Build an allocation model that people can challenge
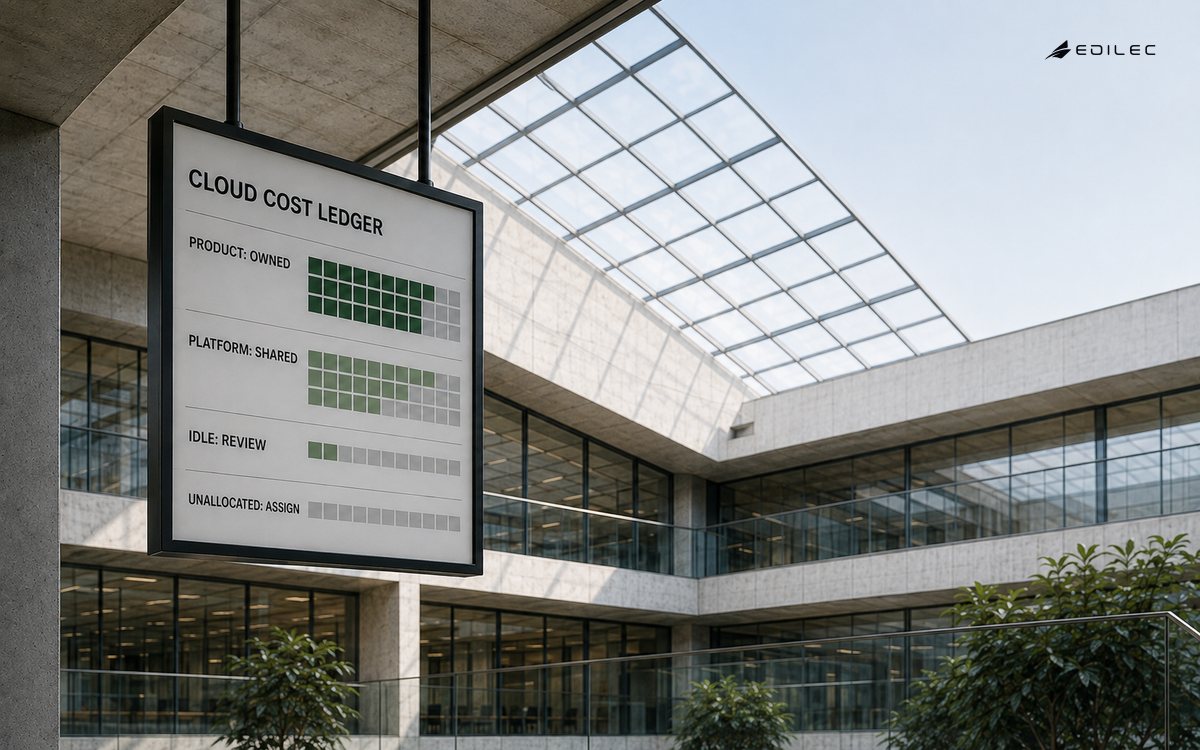
Use account, subscription, project, resource, and workload boundaries before relying on tags. Then apply a governed tag or label vocabulary for product, environment, owner, and cost center. AWS cost allocation tags must be activated before they appear in reports, while Google Cloud labels provide key-value metadata but have service-specific limits. Track unallocated cost as a visible category. A high unallocated percentage is a data-quality signal, not permission to distribute cost arbitrarily.
Shared services require an explicit rule. Allocate a central observability platform by an agreed driver such as indexed volume, active workloads, or a transparent fixed share. Azure cost allocation rules illustrate how shared costs can be reassigned to consuming subscriptions, resource groups, or tags without changing the invoice. Record the driver, effective date, owner, and limitations. Review whether it changes behavior unfairly; an allocation that penalizes efficient teams or conceals fixed platform cost will lose trust.
| Cost class | Preferred treatment | Quality check |
|---|---|---|
| Direct workload | Assign through account, project, resource, or trusted tag | Owner and product coverage |
| Shared platform | Allocate with a documented consumption driver | Driver reconciles to shared total |
| Commitment or discount | Amortize consistently across benefiting usage | Invoice and effective-cost reconciliation |
| Idle or orphaned | Keep visible with accountable owner | Age and deletion decision |
| Unallocated | Report separately and remediate | Coverage trend and exception reason |
Make cost review part of product and architecture work
Use daily anomaly review for material unexpected movement, weekly engineering review for workload drivers, and monthly product-finance review for unit economics, forecasts, and commitments. Compare cost with service-level objectives, throughput, active customers, transactions, storage retention, or another value-relevant denominator. Unit cost can improve while total cost grows because demand grows; total cost can fall while customer value or resilience is harmed. Show both numerator and denominator, plus the architectural event that explains movement.
Work through a practical shared-platform case
A SaaS company sees observability spend rise 35 percent. The provider total is accurate, but product ownership is unclear. The platform team separates log ingestion, metric cardinality, trace volume, and retention, then maps workloads through account and service metadata. It discovers that one new release emits high-cardinality labels and that two retired environments still retain logs. The team removes the retired data, corrects instrumentation, and retains enough telemetry to protect incident response. The review records avoided cost, affected reliability signals, and a guardrail on cardinality. That is a better outcome than an indiscriminate retention cut.
Turn anomalies into owned investigations
An anomaly is a prompt to investigate, not proof of waste. Compare the movement with recent deployments, traffic, data retention, region changes, provider price changes, credits, and commitment coverage. Route it to the team that owns the workload and give that team a useful baseline, affected dimensions, estimated materiality, and a deadline. A threshold should reflect both absolute impact and unusual rate of change; a small service can have a severe percentage increase that is immaterial, while a mature workload can create a major loss through a subtle shift. Close the investigation with a classified cause, decision, expected effect, and verification date. That history improves later alerts and reveals recurring architecture problems.
Keep billing-data defects distinct from workload changes. Duplicate exports, delayed credits, a changed account mapping, or a currency transformation can create apparent spend movement without any change in consumption. Re-run reconciliation before a team alters production. When the cause is real, avoid describing every increase as bad. A higher bill may be the intended result of customer growth, a resilience investment, or a migration that temporarily duplicates capacity. The decision record should state whether the business accepts the increase, wants an efficiency change, or needs a pricing and packaging response.
Treat commitments as portfolio decisions
Reservations, savings plans, and committed-use discounts can lower effective rates, but they exchange flexibility for a forecast. Evaluate them against a stable usage baseline, growth and contraction scenarios, migration plans, regional needs, and the organization’s ability to reassign the commitment. Separate utilization from coverage: utilization asks whether purchased commitment was used, while coverage asks how much eligible usage received the discounted rate. A high utilization result does not prove that the organization bought the right quantity, and broad coverage can still conceal an architecture that consumes too much. Give finance ownership of the commercial commitment and engineering responsibility for the workload assumptions beneath it.
Do not distribute commitment savings in a way that makes product comparisons meaningless. Decide whether savings follow the workloads that created the baseline, are shared across a portfolio, or remain centrally reported. Publish the rule alongside on-demand and effective cost so teams understand both architecture and commercial treatment. Revisit the decision before renewal, after a major migration, and when forecast error exceeds a stated tolerance. This prevents a discount instrument from becoming an invisible constraint on product architecture.
Establish useful visibility in the first 30 days
In the first week, identify billing accounts, invoice owners, detailed exports, currencies, and the ten largest services. Reconcile one complete period and document timing differences. In the second week, map accounts and workloads to product owners, define four or five required metadata fields, and report unallocated cost openly. In the third week, agree on rules for the largest shared services and build a daily cost-and-usage view with freshness. In the fourth week, investigate three material changes with engineering and product owners, then record decisions and expected outcomes. This sequence creates a working feedback loop before the team invests in elaborate forecasting or allocation tooling.
Publish a compact data dictionary with the first view. Define billed cost, amortized cost, effective cost, usage quantity, allocation status, shared-cost driver, and the business denominator used for unit economics. State whether taxes, support charges, marketplace purchases, refunds, and credits are included. Give users a way to trace a chart total to account and service detail without exposing sensitive billing permissions broadly. When a definition changes, set an effective date and preserve prior-period interpretation. This avoids an especially damaging failure mode: two teams using the same cost label for different calculations and drawing opposite conclusions from apparently identical reports.
- Reconcile one invoiced month and one current daily view.
- Name owners for the largest workloads and shared platforms.
- Measure allocated, shared, unsupported, and unallocated cost separately.
- Review one cost movement together with its demand and reliability signals.
- Record allocation assumptions and give teams a dispute route.
- Verify each optimization after implementation rather than booking projected savings as fact.
Key takeaways
- Reconcile cost data before asking teams to trust allocation.
- Use organizational boundaries first, then governed tags and labels.
- Keep shared and unallocated cost visible with documented rules.
- Pair spend with demand, reliability, and product value.
- Give every anomaly and optimization a named decision owner.
- Treat allocation rules as versioned policy, not permanent truth.
Frequently asked questions
Do tags solve cloud cost allocation?
No. Tags add business context but may be missing, unsupported, delayed, or historically inconsistent. Strong allocation combines account structure, resource relationships, governed metadata, and explicit shared-cost rules.
Should a growing company use showback or chargeback?
Start with showback when the data and rules are still being tested. Chargeback changes budgets and behavior, so introduce it only when allocation is reconciled, owners can dispute results, and shared-cost policy is accepted.
How often should teams optimize cloud cost?
Review continuously at different rhythms: anomalies daily, workload drivers weekly, and unit economics or commitments monthly. Optimization should follow meaningful evidence, not a recurring demand for arbitrary percentage cuts.
Conclusion
Cloud cost visibility turns billing records into a shared product and architecture language. Build a trustworthy data foundation, state allocation assumptions honestly, connect spend to value and reliability, and put decisions with the teams able to change the system. Visibility earns its place when it improves choices before the next invoice arrives.