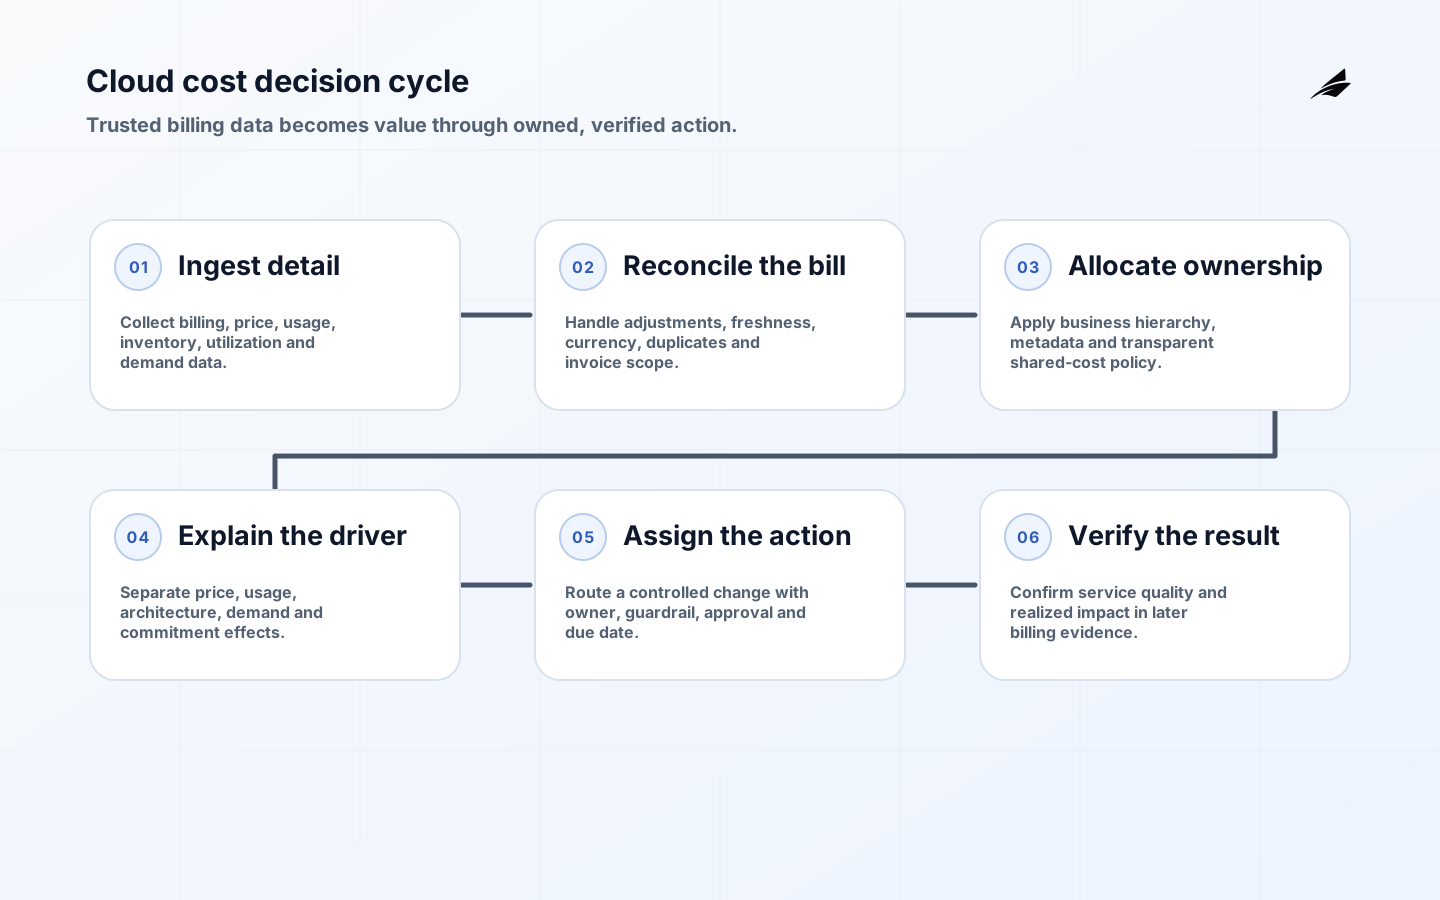
A cloud cost optimization dashboard should help an accountable person decide and act, not merely redraw a provider invoice. It needs reconciled cost and usage data, business allocation, change explanations, unit economics, commitments, anomalies and action status. Different users need different views: finance needs accrual and forecast confidence, engineering needs resource-level drivers, and product leaders need cost relative to delivered value. One crowded dashboard rarely serves all three.
This FAQ complements Edilec's cloud cost dashboard implementation checklist, enterprise cloud cost plan and enterprise dashboard checklist. Begin with decisions, ownership and data contracts before selecting visualization software.
What decisions should a cloud cost dashboard support?
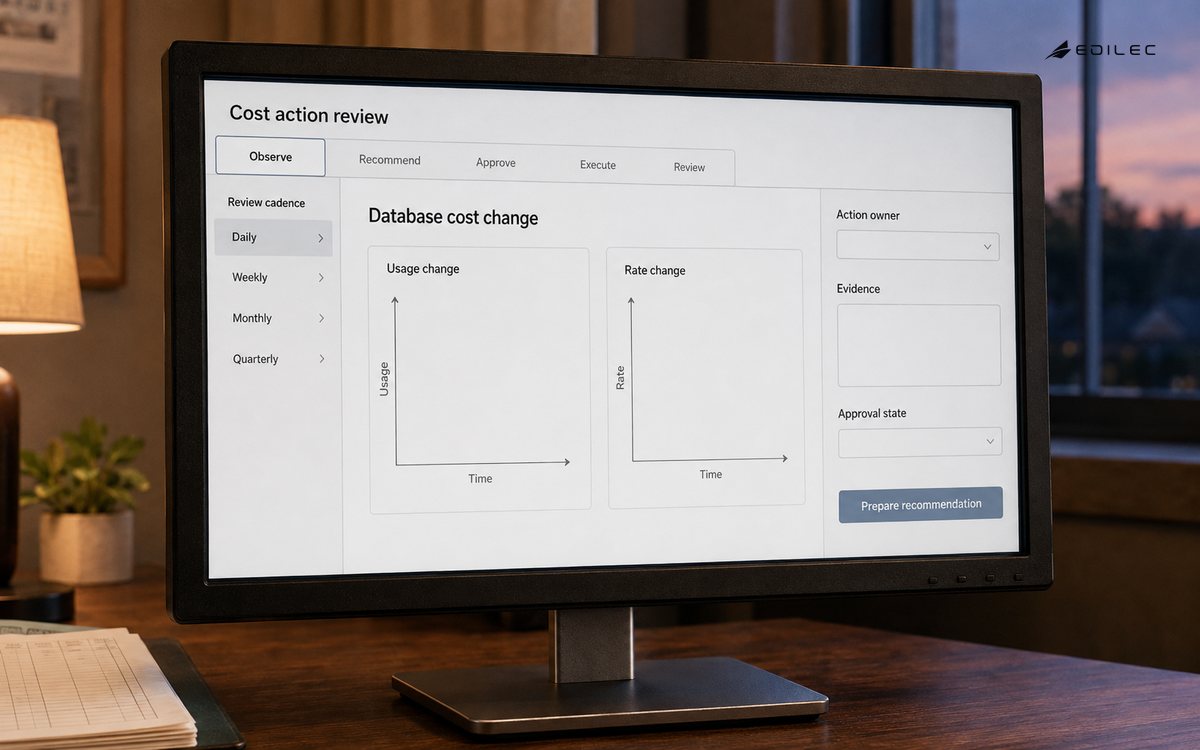
Write the decision, cadence and owner for every view. Daily operations may investigate an anomaly; weekly engineering reviews may rightsize or remove idle resources; monthly finance reviews may reconcile invoices and update forecasts; quarterly product reviews may compare unit cost with margin and service objectives. A metric without an action threshold or owner becomes background information. Separate observation, recommendation, approval and execution so savings remain controlled.
The FinOps Framework describes a collaborative operating practice across engineering, finance and business. Reflect that operating model in access and language. Finance needs invoice and amortization context; engineering needs services, resources and utilization; executives need business value and risk. Maintain shared definitions beneath role-specific pages. If teams calculate amortized cost or savings differently, dashboard debates will replace optimization.
| Audience | Primary question | Action evidence |
|---|---|---|
| Engineering | What changed and what can be controlled? | Owned recommendation with service guardrail |
| Finance | Will actual and forecast reconcile? | Variance explanation and approved forecast |
| Product | What does technology cost per value unit? | Unit trend with demand and quality context |
| Leadership | Where is material risk or opportunity? | Prioritized portfolio with accountable owner |
Which data belongs in the dashboard?
Ingest detailed billing and usage, price, credits, commitments, tags or labels, account hierarchy, resource inventory, utilization, service objectives, budgets and business demand. Preserve provider invoice identifiers and original fields for reconciliation. Microsoft Cost Management exports can deliver recurring datasets, including FOCUS-formatted data. Google Cloud's billing export guidance similarly supports detailed analysis in BigQuery.
Design for late adjustments, refunds, credits, negotiated pricing and currency. Partition by billing period and track data freshness. Reconcile dashboard totals to provider invoices at the agreed scope, then document legitimate differences such as taxes or timing. Store transformation logic in version control and test it with known billing cases. A visually precise chart built from incomplete accounts or duplicated exports is more dangerous than an explicit provisional estimate.
How should cloud costs be allocated?
Create an allocation hierarchy that reflects accountable business structures: product, team, environment, cost center and owner. Use accounts, subscriptions or projects for strong boundaries and resource metadata for finer attribution. The FinOps Foundation's allocation capability covers direct and shared cost strategies. Publish required keys, allowed values, inheritance, shared-cost rules and treatment of unallocated spend. Allocation is a policy, not just tagging.
AWS account tags for cost allocation illustrate how organization-level metadata can map costs to business units, projects or environments. Provider mechanics differ, so normalize meanings in an internal dictionary. Show allocation coverage and unknown spend prominently. Shared platform charges may be assigned directly, split by a driver or shown centrally; choose the method that supports responsibility without pretending precision.
Which optimization metrics are useful?
Show actual, amortized and forecast cost with clear definitions. Add budget variance, allocation coverage, commitment utilization and coverage, idle or underused resources, storage lifecycle, data transfer, anomaly impact and realized savings. Pair each opportunity with effort, risk and owner. Estimated savings from deleting a resource should not appear as realized until billing evidence confirms the change and service quality remains within target.
Unit economics connects spend to demand: cost per order, active account, inference, report or gigabyte processed. Select a unit that represents business value and cannot be improved merely by shifting work elsewhere. Decompose unit cost into price, architecture efficiency and demand mix. Track alongside latency, reliability and customer outcomes. A lower unit cost achieved by dropping redundancy or degrading response time is not optimization unless the business approved that tradeoff.
| Metric | Decision enabled | Required context |
|---|---|---|
| Forecast variance | Adjust plan or investigate driver | Seasonality, launches and commitments |
| Allocation coverage | Fix metadata or shared-cost policy | Unknown and exempt spend |
| Commitment utilization | Buy, exchange or reduce commitment | Demand forecast and flexibility |
| Unit cost | Change architecture, price or product mix | Volume and service quality |
| Realized savings | Validate completed optimization | Baseline, action date and bill evidence |
How should multi-cloud data be normalized?
Preserve provider detail while mapping common concepts such as billed cost, effective cost, service, region, resource and charge type. The FOCUS specification defines requirements for consistent technology billing datasets. Use the current supported version and retain extension columns for provider-specific decisions. Normalization reduces repeated plumbing; it does not erase commercial differences in discounts, commitments or data transfer.
Create conformance tests for mandatory fields, currencies, time zones, corrections and duplicate records. Version semantic mappings and restate history only through controlled changes. Identify whether charts compare list, contracted, billed or amortized cost. Do not force unlike commitments into a single utilization formula without explaining assumptions. Multi-cloud totals are useful for portfolio governance, while optimization usually needs the native resource and pricing detail underneath.
How does a dashboard lead to action?
Create an opportunity workflow with detection, validation, owner, proposed change, approval, implementation, verification and closure. Integrate with engineering work systems rather than emailing screenshots. Suppress recommendations that conflict with service objectives, planned events or known constraints. Record why an item was accepted, deferred or rejected. Automate reversible, low-risk actions only within policy, such as expiring approved sandbox resources after notice.
For anomalies, compare spend with expected behavior at useful scopes and account for seasonality. Route alerts to a team that can inspect both cost and service telemetry. Define severity from financial impact, rate of change and business context. A sudden rise from a successful campaign differs from leaked credentials, but both need explanation. Track detection time, acknowledgement, resolution and prevented or avoided impact without claiming hypothetical totals as savings.
Example: trace an unexpected database cost increase
A dashboard flags a 35 percent week-over-week rise in database effective cost for one product. The investigation view decomposes change into usage, price, region, service tier, reservation and credits. Deployment and demand annotations show that traffic rose five percent but storage input/output doubled after a release. Allocation metadata identifies the product team, while service telemetry shows latency improved only marginally. The evidence points to a query or caching change rather than normal growth.
The opportunity workflow creates an engineering item with owner, estimated impact, service guardrail and due date. The team compares query plans, restores an index and validates latency, error rate and capacity. It does not downsize immediately because that could conceal the cause and threaten reliability. After deployment, the dashboard monitors usage and cost through a complete billing period and records the normalized difference against a documented baseline.
Finance sees the forecast update, product sees unit cost per transaction, and engineering retains provider-level detail. Realized savings are recognized only after bill evidence, adjusted for demand and price. The incident also creates a preventive control: a load test and query-efficiency check for similar releases. This example illustrates why a useful dashboard combines financial data, service context and an accountable work process instead of presenting an isolated red number.
How should the dashboard be implemented and governed?
Deliver in stages: reconcile one provider and scope, establish allocation, add change analysis, connect business units, then automate selected workflows. Use row-level access for sensitive rates and business data while keeping definitions discoverable. Monitor pipeline freshness, reconciliation variance, allocation coverage, query failures and dashboard use. Assign owners for source connectors, semantic models, visual products, cost policy and action workflow. Test recovery and backfill.
Review definitions and actions monthly, and architecture and access at least periodically according to risk. Add new metrics only when they support a decision; retire pages nobody uses. Preserve audit history for allocation and savings changes. Treat provider schema revisions and pricing changes as controlled releases. A dashboard is a FinOps product with users, service levels and a roadmap, not the final step of a reporting project.
Cloud cost dashboard takeaways
- Define the owner, cadence and action for every view.
- Reconcile detailed data before presenting optimization conclusions.
- Publish allocation policy and expose unknown spend.
- Pair cost with demand, unit value and service quality.
- Track opportunities through implementation and bill-based verification.
- Retain provider detail beneath a controlled common cost model.
Frequently asked questions
Are native provider dashboards enough?
They may be sufficient for a small single-provider estate. Custom or third-party layers become useful when the organization needs cross-provider allocation, business-unit metrics, custom unit economics or integrated action workflows. Preserve native tools for provider-specific investigation even when a common reporting layer exists.
How often should cost data refresh?
Match refresh to decisions and source availability. Daily data often supports operational optimization; anomaly use cases may need faster signals; financial close needs complete adjusted data. Display freshness and provisional status. Do not imply real-time precision when provider billing records arrive or change later.
Conclusion
A cloud cost optimization dashboard succeeds when it creates a trusted path from billing records to verified decisions. Reconcile data, allocate it transparently, explain drivers, connect cost to value and assign actions with service guardrails. The dashboard then becomes a practical interface for engineering, finance and product teams to manage technology value together.