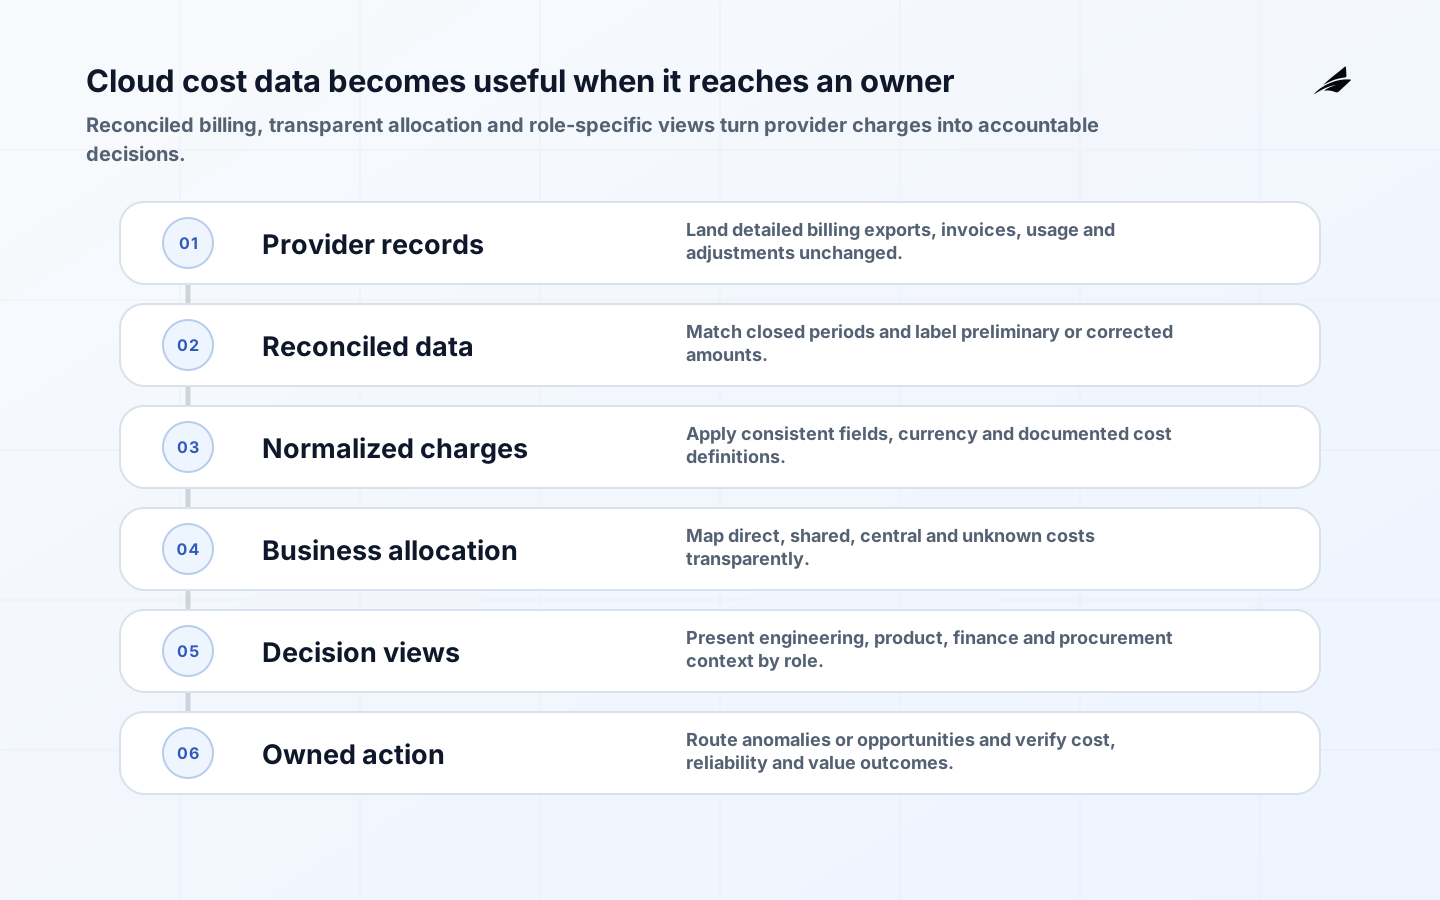
A cloud cost optimization dashboard should connect technical consumption to accountable business decisions. It needs to show what changed, who owns it, whether the cost is allocated, how usage relates to service value and which action is safe. A chart of the monthly invoice is useful for finance reconciliation, but it does not by itself tell an engineering team whether to resize a database, remove an idle environment or change a commitment.
This FAQ focuses on the design and operation of an enterprise dashboard across one or more cloud providers. It follows the FinOps principle that engineering, finance and business roles collaborate on technology value. The cloud and DevOps service is relevant only where a defined implementation need exists; dashboard data should not be used to imply capabilities or savings that have not been measured.
What should a cloud cost dashboard help people decide?
Start with decisions, then select measures. An engineering owner may need to find an unexpected usage increase and compare it with deployments. Finance may need an explainable forecast and invoice reconciliation. A product owner may need cost per completed transaction. Procurement may need commitment coverage and expiry. Executives may need trend, business allocation and value indicators. One screen cannot serve every role without becoming noise, so provide governed views over the same reconciled data.
| Audience | Decision | Useful view |
|---|---|---|
| Engineering | Which resource or behavior changed, and is action safe? | Cost and usage by workload with deployment and utilization context |
| Product | Is cost moving with customer or business value? | Unit cost with volume, quality and reliability |
| Finance | Can actuals, forecast and allocation be explained? | Amortized or invoiced views with reconciliation |
| Procurement | Are commitments used and approaching renewal? | Coverage, utilization, expiry and eligible demand |
| Leadership | Where is material variance and who owns action? | Trend, forecast, allocation quality and action status |
Which data should the dashboard use?
Use detailed provider billing exports as the financial base, preserving provider identifiers and adjustment semantics. Google Cloud documents exports to BigQuery; AWS provides billing and cost-management data and allocation features; Azure provides cost analysis, exports and allocation rules. Ingest invoices or invoice totals for reconciliation. Keep usage and resource metadata, account hierarchy, tags, commitments, pricing and credits with effective dates because late adjustments can change prior periods.

Do not overwrite raw exports. Create an immutable landing layer, a normalized model and curated reporting views. Record ingestion time, source version, currency, charge period and correction status. FOCUS offers an open specification for normalizing technology billing data, which can reduce provider-specific interpretation, but the team still needs mappings for its organizational and business context. Document every derived metric so two dashboards do not give different answers under the same label.
How should costs be allocated to teams and products?
Create a small, governed allocation taxonomy based on decisions: business unit, product or application, environment, cost center, and accountable owner are common examples. Use provider account hierarchy, project or subscription structure, resource groups, labels, tags and mapping tables. AWS requires cost allocation tags to be activated for billing use. Allocation metadata changes over time, so keep effective-dated ownership rather than rewriting history accidentally.
Handle shared platforms explicitly. Some costs can be assigned directly from usage. Others can be distributed by a transparent driver such as requests, compute consumption, active users or an agreed fixed ratio. Some should remain centrally reported when allocation would be arbitrary or costlier than the decision value. Azure's cost allocation feature redistributes costs in management reporting but does not change billing responsibility; distinguish reporting allocation from invoice liability and internal chargeback.
| Allocation class | Method | Dashboard disclosure |
|---|---|---|
| Directly owned | Account, project, subscription or validated resource metadata | Owner and allocation source |
| Shared measurable | Usage-based driver tied to consuming workloads | Driver, period and unallocated remainder |
| Shared estimated | Approved ratio or business rule | Assumption, approver and review date |
| Central | Retained by platform or corporate owner | Reason it is not redistributed |
| Unknown | Temporary unallocated bucket | Amount, age and remediation owner |
Why do invoice, amortized and effective cost differ?
Cash or invoiced views follow charges and purchases as billed. Amortized views spread eligible commitment purchases or fees across the period and usage they support. Effective cost may incorporate negotiated rates, credits or allocation logic according to the organization's definition. None is universally correct. Label the basis prominently and use it consistently for the decision. Finance reconciliation and engineering optimization often need different views that can be traced to the same underlying records.
Should the dashboard automatically apply optimization recommendations?
Usually not without workload safeguards. Provider or custom recommendations are hypotheses based on observed data. Before changing a resource, confirm ownership, service objectives, seasonality, scaling behavior, licenses, reservations, recovery capacity and planned events. A low-utilization instance may be intentionally sized for failover or batch peaks. The dashboard should route a recommendation to an owner with evidence, expected impact, confidence, due date and verification plan.
| Recommendation | Required context | Safe next step |
|---|---|---|
| Delete idle resource | Ownership, dependency, retention and recovery | Quarantine or snapshot under policy before deletion |
| Rightsize compute | Peak, percentiles, autoscaling and service objective | Test smaller capacity with monitored rollback |
| Buy commitment | Stable eligible demand, term and ownership | Model scenarios and obtain finance approval |
| Change storage tier | Access pattern, retrieval time and fees | Pilot a lifecycle policy on bounded data |
| Reduce data transfer | Traffic path, security and architecture | Validate design change and total cost |
| Schedule environment | User hours, startup state and exceptions | Automate schedule with an owner override |
How should cost anomalies be handled?
Use multiple signals: absolute change, percentage change, forecast variance and model-based deviation at useful dimensions. A small percentage on a large service may matter more than a dramatic percentage on a tiny one. Account for seasonality and planned launches. Route alerts to an accountable owner with resource context and a link to deployment or usage changes. Deduplicate repeated alerts and track acknowledgement, cause, action and resolution.
Define response tiers. A suspected credential compromise or runaway resource needs immediate security and operations action; a gradual efficiency regression can enter a backlog. Budgets are planning controls, not hard technical limits unless a separate, deliberately designed mechanism enforces one. Avoid automated shutdown based only on spend because it can harm production or destroy evidence during an incident.
What are useful unit economics?
A unit metric divides appropriately scoped cost by a meaningful output: cost per successful transaction, active tenant, processed record or inference may be useful. The denominator needs an owner, quality checks and consistent time boundary. Pair cost with reliability or quality so teams cannot improve the ratio by degrading service. Avoid vanity units whose relationship to value is weak or whose denominator can be easily manipulated.
Who should access and govern the dashboard?
Apply least privilege to billing exports, negotiated rates, account mappings and user dimensions. Engineering may need resource-level usage without access to confidential commercial terms. Finance may need invoice detail without production permissions. Log exports and administrative changes, protect service credentials and classify dashboard data. Assign data, metric and product owners plus a forum that resolves allocation and policy disputes.
How should the dashboard be rolled out?
- Frame decisions, audiences, cost basis, currency and success measures.
- Land detailed billing data immutably and reconcile a closed period to provider totals.
- Normalize charge semantics and document metric definitions and freshness.
- Allocate one representative product, including an explicit shared-cost rule and unknown bucket.
- Release role-specific views to finance, engineering and product owners; collect decision-based feedback.
- Add anomaly routing and recommendation workflow with ownership and resolution states.
- Introduce unit economics only after denominator data passes quality and ownership checks.
- Expand providers and business units while monitoring allocation coverage and data latency.
Which dashboard risks are commonly missed?
| Risk | Control | Indicator |
|---|---|---|
| False precision | Label freshness, estimates and cost basis | Late adjustment and reconciliation difference |
| Misallocation | Effective-dated taxonomy and unknown bucket | Unallocated cost and disputed mappings |
| Unsafe optimization | Owner review with reliability context | Reverted changes and incidents |
| Alert fatigue | Materiality, seasonality and deduplication | Unacknowledged or repeated alerts |
| Metric gaming | Pair cost with output quality and reliability | Unit cost improves while service degrades |
| Sensitive data exposure | Role-based views and export audit | Unauthorized access or download |
Key takeaways
- Design dashboard views around accountable decisions and audiences.
- Preserve raw billing exports, reconcile totals and label freshness and cost basis.
- Make direct, shared, central and unknown allocation methods explicit.
- Treat optimization recommendations as reviewed hypotheses with service context.
- Connect anomalies and unit cost to owners, workflow status and outcome quality.
More frequently asked questions
Are native cloud dashboards enough?
They can be enough for provider-specific exploration and may be the best starting point. An external data model becomes useful when the organization needs cross-provider normalization, custom business allocation, joined product denominators, longer governance workflows or consolidated reporting. Add complexity only for a defined decision.
Can the dashboard show real-time cloud cost?
Billing data usually has provider-dependent latency and later adjustments. Near-real-time usage telemetry can provide an early signal, but it should not be presented as final cost without a validated pricing model. Display source time and distinguish preliminary estimates from reconciled billing.
Can a dashboard guarantee savings?
No. It can improve visibility, route opportunities and verify changes, but savings depend on demand, architecture, contracts and action. Track gross estimate, approved action, realized cost change and any effect on reliability or business output rather than claiming the recommendation value as achieved savings.
Should every team be charged back?
Not necessarily. Showback may create enough accountability without internal billing. Chargeback requires stable allocation, dispute processes and finance integration. Choose the mechanism that supports behavior and organizational maturity; do not invent arbitrary precision for shared services merely to reach full allocation.
Conclusion
A credible cloud cost dashboard is a governed decision system. It reconciles provider data, explains allocation and cost basis, links changes to owners and prevents optimization from ignoring service risk. Start with one product and one closed billing period, prove the data and action loop, then broaden the view. Trust comes from transparent definitions and verified outcomes, not from the number of charts on the screen.