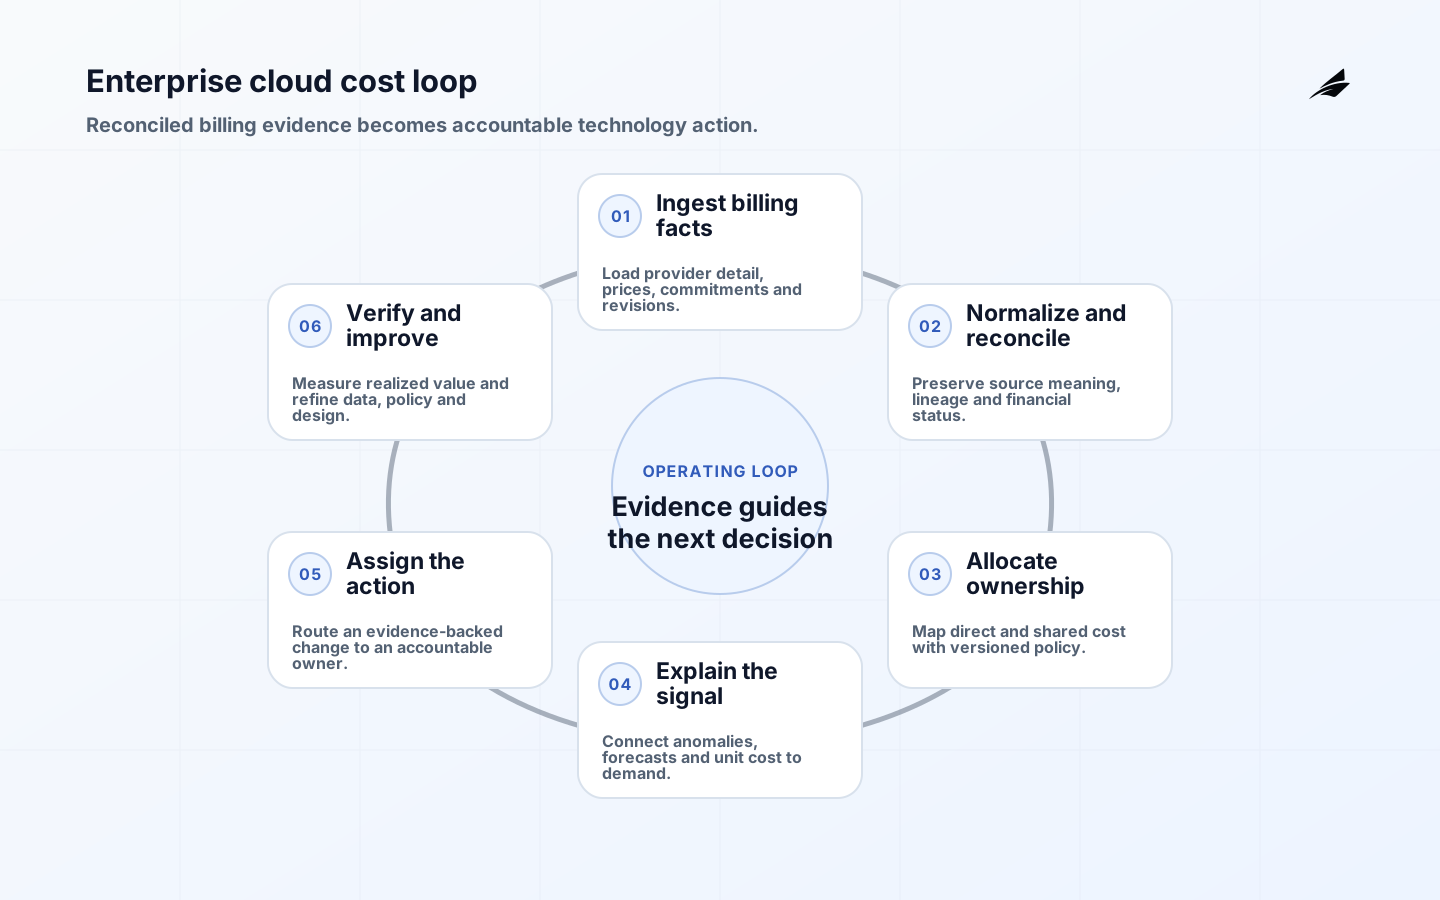
An enterprise cloud cost optimization dashboard should help finance, engineering, product and platform leaders make different decisions from the same reconciled cost evidence. It is not merely a chart of monthly spend. The service must ingest provider billing data, preserve billing semantics, map resources to accountable business scopes, explain shared costs and discounts, detect material change, connect cost to demand and route actions to owners. This guide defines the scope, cost, risk and delivery path for a production dashboard across a complex cloud estate.
Use Edilec's enterprise dashboard implementation checklist after the service boundary is approved. The general cost dashboard checklist covers core mechanics, while the cloud cost dashboard FAQ supports tool and operating-model decisions.
Scope the decisions before the visuals
Interview each audience around a recurring decision. Finance needs invoice reconciliation, accrual and forecast context. Product leaders need cost and value by product or customer. Engineers need attributable usage and a route to act. Procurement needs commitment and marketplace evidence. Executives need material drivers and accountability. The FinOps Framework defines FinOps as a collaborative operating practice that maximizes technology value; a dashboard supports that practice but cannot substitute for ownership and decision cadence.
Define in-scope providers, billing entities, currencies, tax and credit treatment, refresh target, history, allocation dimensions, users and access constraints. Distinguish invoiced, actual, amortized, list and effective cost. State whether the dashboard is for showback, chargeback or directional analysis. A number cannot safely serve all three until allocation policy, discount treatment and reconciliation are explicit. Record the authoritative source for each view and the expected difference from an invoice.
| Audience | Decision | Minimum context |
|---|---|---|
| Executive | Fund, constrain or investigate | Trend, forecast, value driver and owner |
| Finance | Accrue and reconcile | Invoice scope, credits, currency and close status |
| Product | Assess unit economics | Cost by product plus demand or revenue metric |
| Engineering | Change architecture or usage | Resource detail, utilization and service risk |
| Procurement | Manage commitments | Coverage, utilization, expiry and allocation policy |
Build a reconciled cost data foundation
Ingest provider-native detailed exports, price and commitment records, account hierarchy, tags and labels, and relevant business metadata. AWS Cost and Usage Reports provide detailed AWS cost and usage data. Azure Cost Management exports support scheduled delivery of actual, amortized and FOCUS-formatted datasets. Preserve original files immutably, record schema version and make ingestion idempotent because providers can revise recent periods.

Normalize into a stable analytical model without erasing provider-specific meaning. The FOCUS specification offers a common schema for billing data and is valuable for cross-provider analysis. Retain source identifiers and lineage for reconciliation. Model billing period, charge period, service, resource, pricing category, commitment benefit, adjustment and currency. Separate preliminary current-period data from financially closed periods and surface data freshness on every decision view.
Make allocation policy visible and versioned
Map spend through provider organization, account or subscription, resource group, tags, configuration inventory and product ownership. The FinOps Foundation's allocation capability distinguishes allocation, tagging and shared-cost strategies. Measure coverage and show unallocated spend as a first-class category. Do not silently infer an owner from an unreliable resource name. Derived mappings need an owner, effective dates and precedence rules.
Choose a policy for each shared service: central funding, even split, fixed allocation, proportional direct spend or a usage proxy. Publish the rationale and sensitivity. Network, observability and support costs often require different drivers. Version policy so historical reports remain reproducible. Show direct and allocated cost separately to teams, particularly during adoption. Chargeback should begin only when data quality, dispute handling and financial governance are ready; early showback is often more productive.
Design metrics that lead to action
Start with total and amortized cost, forecast variance, allocation coverage, anomaly impact, commitment coverage and utilization, idle cost, optimization realized and unit cost. Pair savings opportunities with performance, reliability and delivery context. A recommendation to remove capacity is unsafe without demand and service-objective evidence. Label provider recommendations, analyst estimates and approved actions distinctly. Avoid summing opportunities that overlap, such as rightsizing and commitment coverage on the same resource.
Define savings against a baseline, observation window and counterfactual. Gross avoided cost differs from invoice reduction; growth can consume the released capacity. Track approved, implemented, verified, rejected and expired recommendations. Assign an engineering or product owner and due date. Measure realized effect after implementation and watch for reliability regression. The dashboard should support a conversation about technology value, not reward indiscriminate reduction.
Build role-based views and workflow
An executive view should show a few material drivers and decisions. Finance needs reconciliation and forecast detail. Product views should combine cost with relevant demand. Engineering needs drill-through to resource and usage evidence. Apply row-level access for sensitive business units and customer economics, and test for leakage through filters or exports. Display refresh time, billing basis, currency and allocation version near every number. Enable download of the rows behind a chart for review.
Connect anomalies and opportunities to a workflow with owner, materiality, status, comment, evidence and outcome. Suppress expected change such as a planned migration only with an expiry. Route alerts according to accountable scope instead of sending every spike to a central team. Keep financial approval separate from infrastructure change authority. A dashboard that identifies waste without a decision path becomes a recurring report-production cost.
| Quality gate | Pass evidence | Do not advance when |
|---|---|---|
| Reconciliation | Defined difference to provider invoice | Material unexplained variance remains |
| Allocation | Coverage and shared policy approved | Large spend has no accountable scope |
| Security | Role and export tests pass | Sensitive unit economics leak |
| Actionability | Owners close representative actions | Findings end in spreadsheets or chat |
| Value | Verified outcomes exceed service cost | Savings are only theoretical |
| Operations | Refresh, schema and incident runbooks work | Builders are the only support team |
Deliver the dashboard in bounded releases
Phase one reconciles one provider and closed billing period. Phase two establishes organization mappings and unallocated views. Phase three adds role-based reporting and anomaly workflow. Phase four introduces unit economics and commitments. Phase five expands providers and chargeback only where required. Each phase should produce a usable decision service. Avoid beginning with every provider and every historical year; schema and policy uncertainty multiply before users can validate results.
Test late files, duplicate delivery, schema change, provider correction, missing tags, currency conversion, account transfer, credit, refund and commitment allocation. Backfill a closed period and reproduce prior reports. Monitor ingestion delay, reconciliation variance, allocation coverage, dashboard latency, access failures and workflow completion. Prepare a provider-export outage path and document which current-period views are provisional. Review policies when organization or cloud contracts change.
Estimate cost and manage delivery risk
Cost depends on provider count, billing volume, history, allocation complexity, business-system integration, BI platform, access model, forecast sophistication and workflow automation. Budget data engineering, FinOps analysis, finance validation, product design, security, operations and change adoption. Recurring cost includes provider exports, storage, transformation, BI capacity, metadata maintenance and analyst time. Compare service cost with verified decisions and avoided manual work, not with the total cloud bill.
Primary risks are inaccurate reconciliation, disputed allocation, exposed commercial data, misleading savings, dashboard sprawl and abandoned actions. Control them with source lineage, policy versions, access tests, evidence labels, metric owners and an operating review. Maintain a data contract for provider exports and test schema changes. Keep the first dashboard narrow enough that finance and engineering can jointly validate every major number.
Establish ownership for definitions and disputes
Assign a billing-data owner, allocation-policy owner, finance approver, platform operator and business-scope owners. Publish a dispute route with response time, evidence requirements and effective-date rules. Corrections should update the mapping or policy source, trigger a controlled backfill and preserve prior published versions. Avoid repairing numbers only in the visualization. Review the largest unallocated and disputed amounts before close, and distinguish a data-quality correction from a retroactive change to commercial policy.
Treat optimization recommendations as managed work. Record affected service, hypothesis, owner, expected saving, reliability constraint, approval, implementation and verification window. Group dependent actions to avoid double counting. Expire recommendations when architecture or price changes. Sample rejected actions to learn whether the dashboard lacks context or the recommendation is unsuitable. The central FinOps team should improve shared data and methods while engineering and product owners retain authority for service tradeoffs.
Publish a compact data dictionary beside the dashboard. Define each cost basis, allocation status, forecast, anomaly and savings state with an owner and calculation version. This reduces recurring disputes and lets reviewers distinguish a changed cloud bill from a changed reporting rule.
Key takeaways
- Scope the dashboard around decisions for finance, product, engineering and procurement.
- Preserve provider billing semantics and reconcile before presenting normalized totals.
- Version allocation and shared-cost policies so reports remain explainable.
- Tie every anomaly or opportunity to an owner, workflow and verified outcome.
- Expand provider coverage only after the core service is secure, supportable and useful.
Frequently asked questions
Should an enterprise build or buy a cost dashboard? Use provider and commercial tools where they fit, but expect custom allocation, business metrics and workflow integration. Is tagging enough for allocation? No; account hierarchy, inventory and derived mappings are often needed, especially for shared services. How fresh should cost data be? Match refresh to decisions and clearly label provisional data; billing is not always real time. Can one dashboard support chargeback? Only after financial policy, reconciliation and dispute handling are mature. How are savings verified? Compare an approved baseline with observed cost and demand after change, accounting for overlapping actions and side effects.
Conclusion
An enterprise cloud cost optimization dashboard is a governed decision service built on billing evidence. Start with reconciliation and accountable scopes, expose allocation policy, connect cost to business demand and close the loop from finding to verified action. When finance and engineering can explain the same number and act from it, the dashboard has moved beyond reporting into useful FinOps operations.