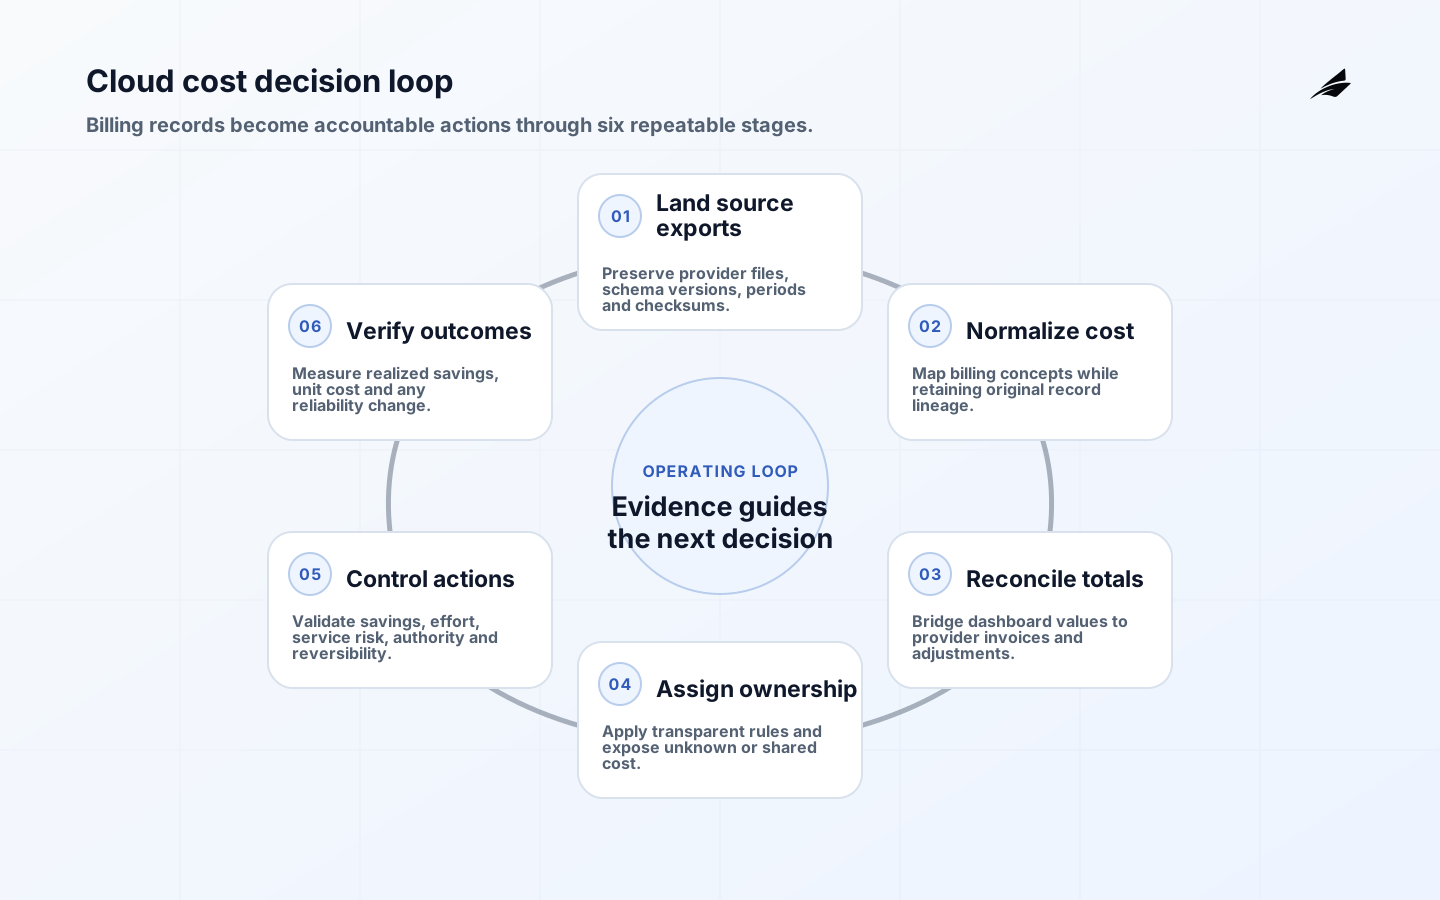
A cloud cost optimization dashboard for small business should help someone decide what to investigate, change or approve. It is not a prettier copy of the provider invoice. Useful dashboards reconcile billing data, assign costs to accountable owners, explain commitments and credits, connect spend to business demand, and show whether an optimization harmed reliability. This guide defines a practical scope, cost model, risk register and delivery plan for a small team that needs control without building an enterprise data platform.
Use the small-business dashboard implementation checklist during delivery and the cloud cost dashboard FAQ for buyer questions. The cloud cost dashboard data model guide goes deeper into shared metrics. Begin by naming the finance owner, technical owner and workload owners who can act on findings; a dashboard with no decision rights becomes passive reporting.
Define the decisions before the charts
Interview finance, engineering and business owners about recurring decisions: explain month-over-month change, forecast cash needs, find unowned resources, evaluate commitments, identify idle capacity, allocate shared platforms and understand product unit economics. For each decision, record cadence, materiality threshold, dimensions, latency and action owner. A founder may need weekly forecast and anomaly context; an engineer needs resource-level evidence; accounting needs invoice-aligned totals. Do not force all three into one crowded page.
Choose a small metric contract. Define billed cost, effective or amortized cost, list cost, credits, commitment benefit, usage quantity, allocation coverage, forecast and savings realization. State currency conversion, taxes, support fees, marketplace charges and timing. The FOCUS 1.2 specification provides normalized billing concepts for cloud and SaaS costs. Use it directly where exports conform or map provider fields into a versioned internal model, preserving the original records for reconciliation.
| Decision view | Primary question | Minimum dimensions |
|---|---|---|
| Executive | Are spend and forecast aligned to plan? | Month, provider, product |
| Owner | Why did my workload change? | Owner, service, region, resource |
| Optimization | Which action is worth taking? | Resource, usage, rate, risk |
| Commitments | Is coverage and utilization healthy? | Commitment, term, eligible use |
| Allocation | Which costs remain shared or unknown? | Account, tag, allocation rule |
Ingest billing exports with replay and provenance
Use provider billing exports rather than screen scraping. AWS Cost and Usage Reports can publish detailed cost and usage data to an owned S3 bucket. Azure Cost Management exports support recurring datasets including actual, amortized and FOCUS-formatted cost. Google Cloud billing export can deliver usage cost and pricing data to BigQuery. Confirm account types, fields, update behavior and retention for the actual contract.
Land immutable source files or snapshots with provider, billing account, export type, schema version, billing period, receipt time and checksum. Make ingestion idempotent so reruns replace or merge the intended partition without duplicating charges. Expect providers to revise current-period data and post late charges. Reprocess an open window, track row and amount changes, and close periods only after invoice reconciliation. Alert on missing files, schema drift, duplicate keys, unexpected currencies and large unexplained balance changes.
Build an allocation and ownership model
Create dimensions for provider, billing account, legal entity, environment, product, team, cost center and workload. Derive ownership from a controlled precedence: direct resource label, account or subscription mapping, platform allocation rule, then unknown. Keep the raw label and the rule that assigned each record. Never overwrite unattributed cost to make coverage look better. Publish unknown spend by amount and age with the person responsible for fixing the source mapping.

Shared cost allocation should match the decision. A central network may be split by direct usage, workload spend, transactions, headcount or a fixed budget. Each method embeds incentives, so document numerator, denominator, period, exclusions and owner. Show direct and allocated cost separately. Recalculate historical periods only under a versioned restatement policy; otherwise owners cannot explain why last month's dashboard changed. For small teams, a transparent monthly rule often creates more trust than an elaborate model nobody can reproduce.
Turn recommendations into controlled actions
Classify opportunities as waste removal, rate optimization, architecture improvement or demand management. For each candidate, calculate baseline period, estimated gross savings, implementation effort, confidence, service risk, reversibility and owner. Validate usage metrics because billing records alone may not reveal memory pressure, request latency or seasonal demand. Deleting an apparently idle standby or shrinking a database can save money while violating recovery or performance expectations.
Track recommendations through proposed, validated, approved, implemented, verified and rejected states. Record rejection reason so the same unsuitable advice does not return weekly. Verify realized savings against a counterfactual baseline adjusted for demand and price changes; avoid claiming the full recommendation estimate. Commitments require separate analysis of eligible spend, utilization, coverage, break-even, term and business uncertainty. Only an authorized customer owner should approve a long commitment.
| Metric | Definition discipline | Misleading shortcut |
|---|---|---|
| Effective cost | Amortized commitments and allocated discounts | Cash purchase in one month |
| Savings realized | Post-change cost versus adjusted baseline | Recommendation estimate |
| Allocation coverage | Cost with accountable owner divided by scoped cost | Percent of resources tagged |
| Forecast variance | Actual versus frozen forecast version | Latest forecast versus actual |
| Unit cost | Effective cost per stable business unit | Spend divided by any available count |
Design views for investigation, not decoration
Lead each view with current value, comparison, material drivers and freshness. Let users move from total to provider, account, product, workload and resource while preserving filter context. Use bars for comparison, lines for time and tables for exact reconciliation. Avoid pie charts with many services and red-green-only status. Every chart needs a clear period, currency, cost basis and accessible tabular alternative. Include a link or identifier that lets an engineer locate the underlying resource.
Give finance an invoice bridge from provider statement to dashboard total, including taxes or charges deliberately excluded from optimization. Give engineering a daily or weekly operational view with anomalies and actions. Restrict rates, discounts and sensitive allocations according to role, but do not hide enough context to make action impossible. Log access and administrative changes. Cache common queries and aggregate older data to control the dashboard's own cloud cost, then display data freshness honestly.
Deliver a thin reconciled slice first
A practical first release covers one provider, one closed invoice period, top workloads, ownership coverage, monthly trend and a drill-through to source records. Stage one defines decisions and metrics; stage two lands exports; stage three reconciles a period; stage four adds ownership; stage five introduces optimization workflow; stage six expands providers and unit economics. Each stage should have data tests, named users and a decision it improves. Resist adding predictive features before basic totals are trusted.
Cost depends on provider count, account structure, export access, history, allocation complexity, dashboard platform and integration with tickets or budgets. Separate one-time discovery and backfill from recurring storage, queries, licenses and ownership. A focused single-cloud implementation may be measured in weeks; disputed mappings and multi-currency contracts can dominate longer programs. Price data-quality remediation explicitly. The dashboard cannot infer a missing business owner from a cryptic resource name with dependable accuracy.
Operate the dashboard as a FinOps product
The FinOps Framework emphasizes collaboration among engineering, finance, procurement and business roles. Apply that with a weekly anomaly and action review, monthly invoice and forecast review, and quarterly commitment and allocation review. Assign owners for data ingestion, metric definitions, allocation rules and dashboard experience. Version changes and communicate restatements. Keep optimization accountable to reliability, security and product demand rather than making a percentage reduction the only objective.
Monitor export arrival, processing latency, reconciliation difference, unknown allocation, query performance, action completion and realized savings. Sample dashboard records back to provider detail. Review permissions and dormant users. Maintain runbooks for late data, schema changes, invoice corrections and a broken mapping. The product earns trust when finance can reconcile it, engineers can act from it, and leaders can distinguish a genuine efficiency gain from a delayed charge or changed allocation rule.
Document the monthly close procedure for cloud cost. Freeze a dashboard version, ingest late adjustments, reconcile provider subtotals to the available invoice, explain exclusions, and obtain finance sign-off before publishing closed-period figures. If a provider later corrects the bill, post a versioned restatement with the old value, new value, reason and affected unit metrics. Keep operational estimated cost available during the month, but label it separately from closed financial reporting. This distinction prevents an engineering view optimized for speed from becoming an accidental accounting record.
Key takeaways
- Design around recurring cost decisions and accountable action owners.
- Preserve raw billing data, schema provenance and replayable processing.
- Reconcile to invoices before presenting optimization conclusions.
- Keep allocation rules transparent, versioned and honest about unknown cost.
- Verify savings after implementation and balance them with service risk.
Frequently asked questions
Are native cloud cost tools enough?
They may be for a small single-provider estate with simple ownership. Build or integrate a separate dashboard when the business needs cross-provider normalization, custom allocation, unit economics, workflow or invoice bridges the native view cannot provide. Validate the added operating cost before creating another analytics system.
Does cost data need to be real time?
Usually not. Provider billing data is delayed and revised, so a real-time label can overstate certainty. Daily operational data is often enough for anomalies, while closed-period reconciliation is appropriate for accounting. Show receipt and coverage timestamps and use telemetry, not billing records, for immediate capacity protection.
Should AI generate optimization recommendations?
It can rank or summarize candidates, but an owner should verify inputs, service requirements and financial assumptions before action. Preserve the evidence and model or rule version. Never allow an opaque recommendation to delete resources or purchase commitments without defined authority and rollback.
Conclusion
A small-business cloud cost dashboard works when it closes the path from provider record to accountable decision. Start with reconciled data, stable definitions and visible ownership; then add optimization workflow and unit economics. That order creates a modest system people can trust and act on instead of an attractive report that merely repeats yesterday's bill.