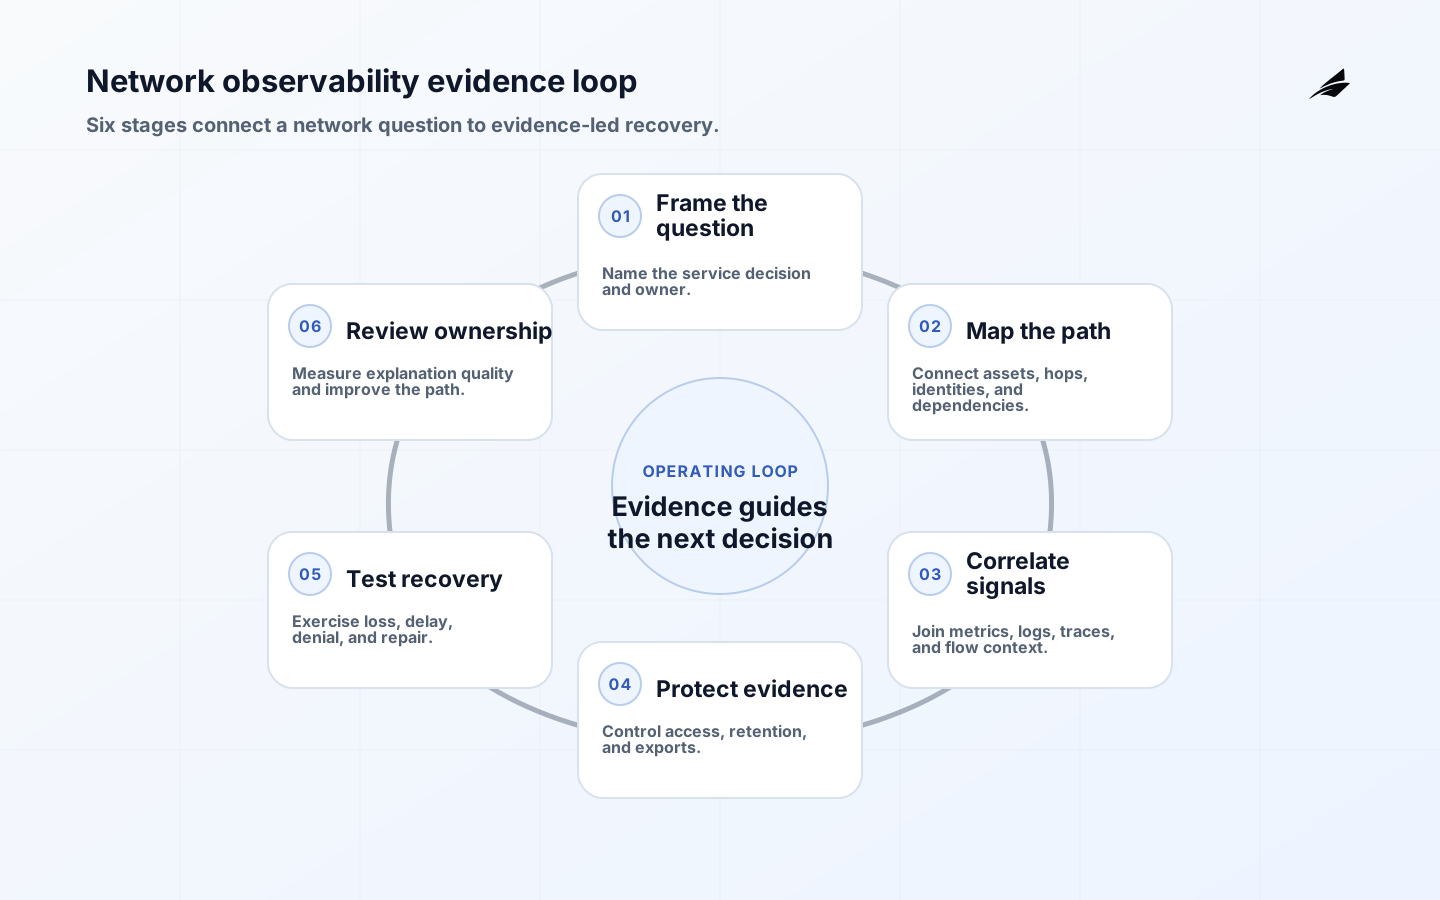
Network observability gives a CTO a way to ask why a connected service behaved as it did. It is not the same as putting more charts beside a monitoring console. A useful design connects an operating question to signals that explain a request, device exchange, queue, or customer-visible delay. OpenTelemetry describes observability as the ability to ask questions about a system from the outside and uses metrics, logs, and traces as complementary signals. For a connected operation, that means preserving enough network and application context to distinguish a slow route from a slow dependency, a rejected device from a broken link, and an unavailable service from a stale screen. The decision is not whether to collect everything; it is which evidence lets an accountable person choose the next safe action.
Name the decision before collecting signals
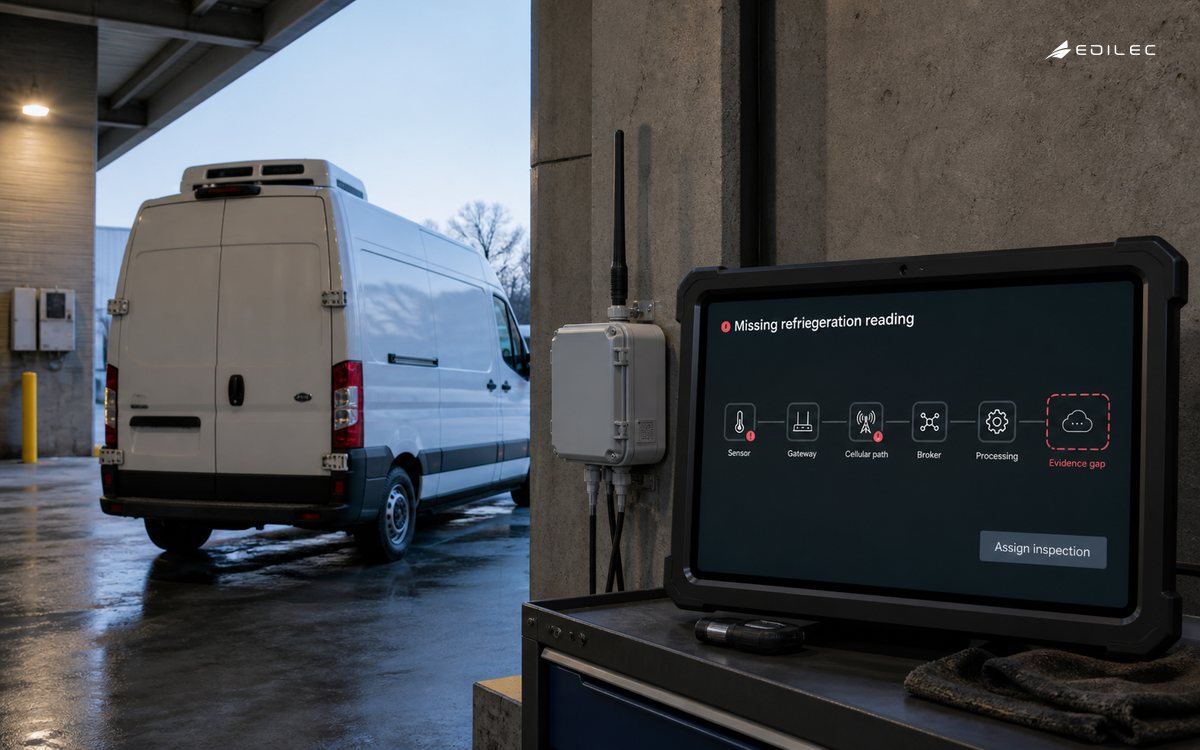
Start with one decision that becomes expensive when the network is uncertain. A service owner might need to reroute traffic, pause an edge rollout, ask a technician to inspect a site, or tell a customer that a result is delayed. Write the question with a scope, time window, owner, and acceptable action. For example, the fleet support lead may need to know within ten minutes whether a missing refrigeration reading is caused by the sensor, gateway, cellular path, broker, or processing service. This creates a boundary around the first release and stops the team treating packet count or dashboard visits as outcomes. A signal earns its place when it can change a decision or reduce the time needed to explain one.
| Question | Useful signal | Decision it supports |
|---|---|---|
| Is the device reachable? | Last authenticated exchange and age | Retry, contact site, or mark stale |
| Did the request complete? | Trace or correlation ID across hops | Avoid duplicate action or reconcile state |
| Where did delay grow? | Per-hop latency and queue age | Scale, reroute, or contain a dependency |
| Is the reading trustworthy? | Quality, source time, receipt time | Withhold action or show an explicit unknown |
Map the real path from source to consequence
Map the path an important event actually follows: device, local network, gateway, transport, broker or API, ingestion service, storage, calculation, interface, and human or automated action. Record the identity used at each boundary, protocol, expected freshness, and owner. Keep physical and logical relationships distinct. Two assets can share a switch but have different consequences; one service can sit in one cluster while depending on a remote identity provider or broker. The CTO should ask whether the path can be reconstructed for one normal event and one failed event without a screenshot. If not, the architecture has a visibility gap even if every component emits a heartbeat. Use sensor data pipelines for connected systems when the event begins as a measurement, and add route, authentication, queue, and service context to the source evidence.
Choose signals with context, not volume
Metrics show rates, durations, errors, saturation, and backlog. Logs capture events such as authentication failure, policy denial, route change, device replacement, or queue overflow. Traces connect one request across services and show which hop consumed time. Flow records, link counters, DNS outcomes, certificate state, and broker offsets help when tied to a service journey. A packet capture can help an investigator, but it is rarely a complete operating control. Correlate logs with spans and preserve asset, tenant, route, protocol, and outcome context. A timestamp without a shared operation or asset identity creates correlation work at the moment the team is already under pressure.
| Signal family | Minimum context | Failure if omitted |
|---|---|---|
| Metric | Asset, service, unit, time window, status | Averages hide the affected path |
| Log | When, where, who or machine, what, severity | An event cannot be scoped |
| Trace | Operation ID, parent-child relation, key attributes | Teams argue across requests |
| Flow or link | Endpoint, route, protocol, direction, sampling | Reachability is mistaken for work |
Build the evidence path before the alert catalogue
A useful alert has a recipient, consequence, threshold or pattern, and next action. Start with missing telemetry, delayed command confirmation, repeated authentication failure, and a request that crosses a gateway. Define evidence that should be present, evidence that indicates uncertainty, and the first responder. Avoid alerting on every symptom: one broken gateway can produce thousands of connection failures. Group the incident while retaining underlying records. A stale-state indicator may be more useful to an operator than a red banner with no recovery instruction. Keep high-volume diagnostic data separate from the few alerts that require immediate human attention.
Make evidence safe to collect and use
Network evidence can contain identifiers, locations, payload fragments, credentials in errors, or customer activity. Define what may be collected, who may view it, retention, and disposal. OWASP logging guidance recommends enough context for analysis while excluding secrets and protecting integrity and availability. A support view can show device, route, error class, and correlation ID without exposing payloads; an incident responder can obtain deeper evidence through a controlled request. Record exports and access. Treat troubleshooting copies as governed data, not as harmless temporary files. NIST’s IoT baseline also helps the CTO ask how device identity, configuration, and lifecycle state affect interpretation of a network event.
Test recovery and ownership as one capability
Run controlled tests for link loss, DNS failure, certificate expiry, broker unavailability, queue growth, clock drift, route asymmetry, and partial service failure. Observe whether a named person can identify scope, choose containment, and verify recovery. Include data that arrived late or twice, an action attempted while a dependency was down, and evidence needed to reconcile final state. NIST’s Cybersecurity Framework gives a useful structure for connecting protection, detection, response, and recovery. The network segmentation production guide is helpful when a test changes reachability or adds an enforcement boundary. A technically available stream can still be unsafe if it causes an uncertain command to repeat.
Measure the quality of the explanation
Track time to identify the affected path, incidents with a usable correlation ID, oldest unresolved queue, stale-data duration, false-positive alert rate, and incidents resolved without manual packet collection. Review whether operators distinguish unavailable, delayed, rejected, and not-yet-observed states. Measure storage, query, and access-review cost as well. Retire telemetry that supports no decision and invest in missing context where investigations stall. Observability is mature when it reduces uncertainty for the person responsible, not when it increases the volume of stored signals.
A practical rollout plan for a CTO
- Choose one business-critical connected journey and write normal and degraded paths.
- Inventory assets, hops, identities, owners, freshness rules, and data classes.
- Instrument metrics, structured logs, and traces with one correlation convention.
- Test loss, delay, denial, duplication, and recovery before adding broad alerts.
- Give support a view that explains scope, evidence age, next action, and escalation owner.
- Review findings monthly and remove signals that create noise without improving a decision.
Run a decision review before widening coverage
Before adding another collector or dashboard, replay one normal journey and one degraded journey with the people who own the consequence. Ask the operator to identify the signal that is current, the signal that is stale, and the action that is safe. Ask support to locate the operation without privileged infrastructure access. Ask security which evidence can be retained and which fields must be redacted. Ask engineering to show where a retry becomes a duplicate effect. Record disagreements as design work rather than smoothing them into a single availability number. A good review often finds that the missing capability is not more network data but a stable asset identity, a source timestamp, a policy version, or a clear state such as awaiting confirmation. Use network segmentation decisions before the first build when the review shows reachability and authorization have been conflated.
Keep the review evidence close to the journey it explains. Store expected path, observed path, affected asset or tenant, first response, containment choice, final outcome, and follow-up owner. Compare the result after a release or topology change. This gives the CTO a way to decide whether to expand instrumentation, simplify architecture, change an alert, or accept a bounded limitation. The value is visible when a new responder can answer what happened, what remains uncertain, and what must not be repeated. If the same question remains unanswered three times, treat that as a product or architecture gap with an owner and a date rather than buying another unconnected tool.
A useful CTO review also asks whether the observability system itself is dependable. Check collector failure, dropped telemetry, clock drift, access changes, retention expiry, and topology updates. Make absence of evidence visible; a green tile should not mean that no telemetry arrived. Define a fallback for investigations when the primary backend is unavailable and keep important evidence in a durable, access-controlled path. This prevents high-consequence decisions on an empty dashboard. It also creates a natural conversation with event streaming for connected systems, where backlog, replay, and consumer ownership determine whether evidence can be trusted after interruption.
Key takeaways
Keep one explicit unknown state in every operator view. If the collector is down, the route is unverified, or the device has not reported within its policy, show that uncertainty instead of inheriting the last green state. A response can then be proportionate: wait, retry, contact a site, contain an action, or investigate. This is more useful than a universal uptime target because it ties network evidence to the work that depends on it.
The OpenTelemetry observability primer grounds the distinction between signals and reliability; the NIST Cybersecurity Framework helps organize response and recovery; the NIST IoT device baseline keeps device lifecycle context visible; and the OWASP Logging Cheat Sheet helps make event records useful without exposing secrets.
- Begin with a decision and service journey, not a telemetry inventory.
- Correlate network, device, application, and user context across boundaries.
- Treat freshness and uncertainty as first-class states.
- Protect observability data like operationally sensitive information.
- Test recovery with the people who must explain and repair the incident.
Frequently asked questions
How is network observability different from monitoring?
Monitoring checks known conditions and reports thresholds. Observability adds context for investigating unexpected behaviour and asking why a result occurred. Production teams usually need both: monitors for detection and correlated evidence for explanation.
What should a small team instrument first?
Instrument one important journey end to end. Capture request or event identity, source and destination, outcome, duration, freshness, error class, and owner. Add deeper network detail where that journey repeatedly becomes hard to explain.
Do we need full packet capture?
Not by default. Full capture can be costly and sensitive. Use it for bounded investigations or high-value paths with clear retention and access rules, while relying on structured correlated telemetry for routine operation.
Conclusion
For a CTO, network observability is an explanation capability. Define the operating question, map the real path, preserve context across boundaries, and make evidence safe and actionable. When recovery tests include ownership and reconciliation, the network becomes a service the organization can reason about.