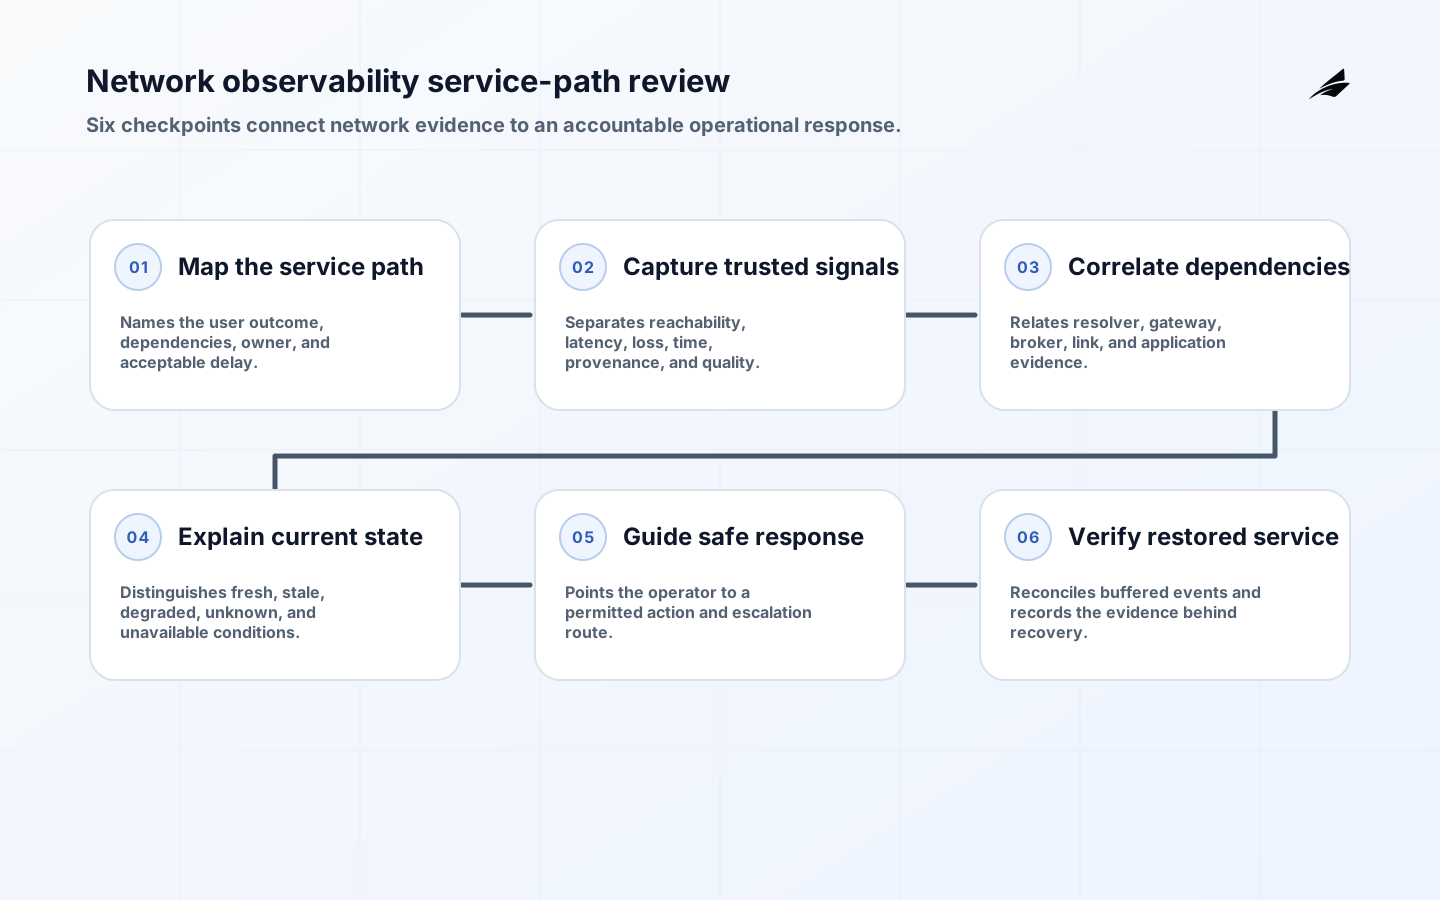
Network observability is useful when it helps an operations leader explain a service outcome and choose a safe next action. A green dashboard is not enough. The team must distinguish a resolver failure from a congested link, an expired credential from a powered-down gateway, and a device outage from a reporting gap. That means connecting network signals to the service and physical workflow they support. NIST's OT security guidance is a useful anchor because it treats reliability, safety, and security as connected concerns. Start with one decision, then collect only evidence that changes it.
Set the operating boundary
Network observability should start with a named service path, not a vendor inventory. Write down the devices, links, resolvers, gateways, applications, and physical actions that make the path work. For a refrigerated logistics site, the boundary may run from a temperature sensor through a cellular gateway, broker, alert service, and dispatch queue. State what the operator needs to decide when a reading is late or a link is unavailable. The boundary also names exclusions: a signal nobody can act on should not quietly become a critical alert.
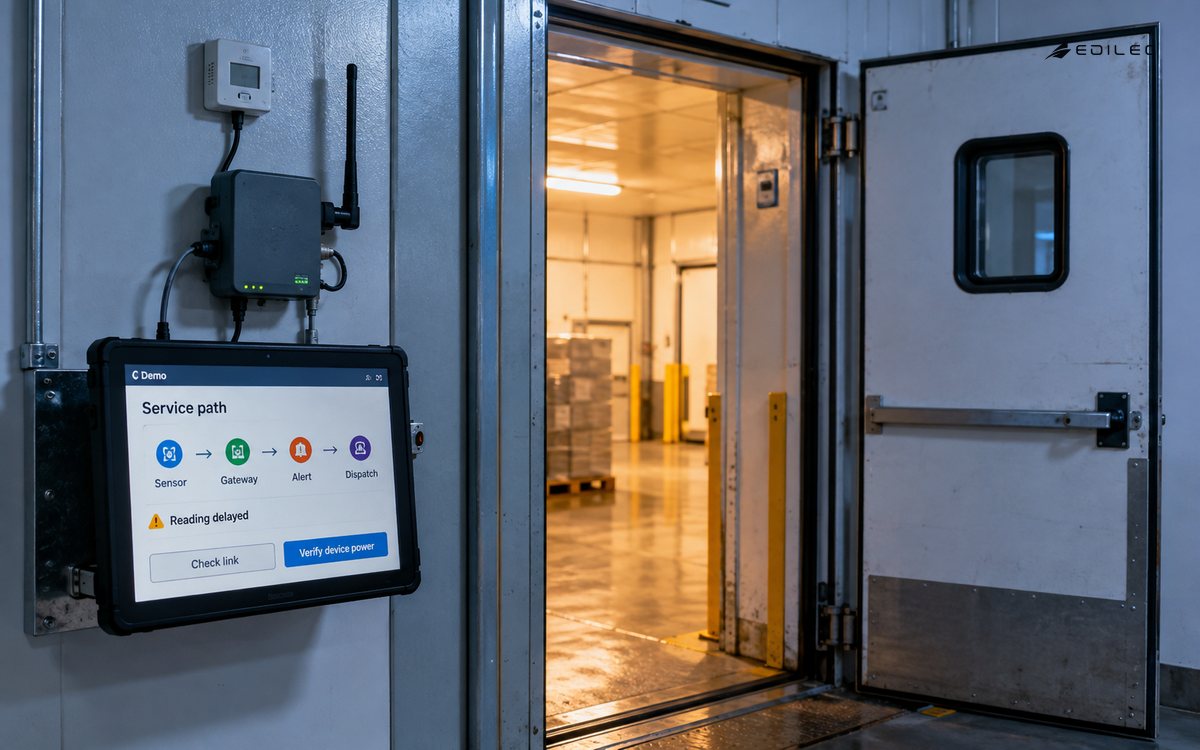
Interview the operator, service owner, and person accountable for customer or safety impact. Ask what a normal day looks like, how maintenance is announced, which dependency fails first, and what must remain possible during a network interruption. Record owner, acceptable delay, degraded behavior, and escalation route. This prevents the observability platform becoming a second system of record that nobody trusts.
Build a model that joins signals to meaning
A network model should relate reachability, latency, loss, authentication, configuration changes, device health, and the service outcome that an operator is trying to protect. It also keeps event time separate from collection time. A gateway can receive a sensor reading late; calling it current because it arrived recently is misleading. Give every signal a source, unit, timestamp semantics, quality state, retention period, and interpretation. The network observability checklist is useful when the question is which path or boundary is failing.
Use a small vocabulary for healthy, delayed, stale, unreachable, degraded, and unknown. Define transitions rather than relying on color. If a gateway loses upstream access but continues buffering locally, the service may be degraded rather than down. If the clock is untrusted, preserve the observation while marking temporal confidence. A good model explains why an alert fired and why an operator was allowed to acknowledge, suppress, or escalate it.
| Scope question | Concrete decision | Evidence to keep |
|---|---|---|
| Operational purpose | Which operator or customer decision changes? | Named owner, action, acceptable delay |
| Signal meaning | What do fresh, stale, and unknown mean? | Contract, units, timestamps, test cases |
| Boundary | Which paths and dependencies are included? | Versioned inventory and owner map |
| Access | Who may inspect, change, suppress, or export? | Role mapping and access review |
Design trustworthy collection boundaries
Collect from network equipment, gateways, resolvers, brokers, application edges, and device management services according to a documented question. Protect management interfaces separately from data paths, synchronize clocks where possible, and minimize payload collection when metadata is sufficient. NIST's Cybersecurity Framework supports a governance-to-recovery view that is more useful than treating observability as a dashboard purchase. Each boundary needs an owner, access rule, and failure behavior.
Prefer a path an investigator can trace from symptom to cause without joining incompatible time bases by hand. A collector can normalize fields, but it must preserve source identity and original timestamps. Keep credentials out of logs, restrict who can inspect site-sensitive topology, and record configuration changes with the same care as performance events. If a collector is unavailable, show that absence explicitly; do not turn missing evidence into false normality.
Choose signals by decision and cost
Sampling should follow the question. High-frequency link data may be justified during diagnosis, while a daily capacity question may need only aggregates. Capture latency distributions instead of a single average when tail behavior affects a workflow. Track DNS failure rate, certificate age, broker connection churn, gateway queue depth, heartbeat freshness, and application success separately. OpenTelemetry's documentation explains how traces, metrics, and logs can be generated and collected, but a team still chooses which evidence matters.
Write a signal contract for every alert: trigger, evidence window, expected delay, suppression rule, owner, and action. A heartbeat missing for five minutes should not page during declared maintenance, but it should create a visible stale state. A high retry count may mean a broker is unavailable or a client is misconfigured. The contract keeps an operator from reacting to an impressive number with no bounded meaning.
Roll out from one critical path
Choose one path where diagnosis is slow, expensive, or unsafe. Baseline ordinary behavior, then instrument the path before adding adjacent services. Test a planned link interruption, clock skew, revoked credential, queue backlog, and device that sends malformed or duplicate readings. Have an operator investigate using only normal permissions and runbooks.
Acceptance should prove that the signal arrives with context, the alert points to a permitted action, the service degrades as expected, and recovery can be verified. Measure time to identify the responsible boundary, not only the number of metrics collected. Add another site or device class only after the first path has an owner and a rehearsed recovery.
| Failure condition | Safe response | Recovery proof |
|---|---|---|
| Collector unavailable | Mark evidence stale; keep last confirmed state | Restored collector and explained gap |
| Clock disagreement | Preserve both times and lower confidence | Time source corrected and interval reconciled |
| Gateway disconnected | Show degraded operation and queue age | Buffered data reconciled or loss recorded |
| Alert flood | Apply bounded suppression with an owner | Cause fixed and suppression retired |
Review signals that change behavior
Useful measures include critical-path coverage, stale-signal rate, clock-skew rate, false-positive alerts, time to isolate a boundary, and incidents with verified recovery. Pair each with an owner. Coverage without freshness can hide silent failure; freshness without provenance can make a wrong reading look authoritative. Review acknowledgement, suppression, escalation, and runbook completion as workflow signals.
If the same gateway repeatedly loses connectivity after a maintenance step, the answer may be change control rather than networking. If alerts are routinely muted, examine the threshold and work it creates. Keep a decision log for threshold, device-class, and retention changes so future responders can tell whether an improvement reflects a real fix or a quieter dashboard.
Plan for missing or contradictory evidence
When a collector fails, preserve the last confirmed state with its age and mark current state unknown. When a device conflicts with a gateway or application event, quarantine the conflict rather than silently choosing the most recent message. When a link returns, reconcile buffered events and identify any interval that cannot be reconstructed.
Recovery is a business process as much as a technical one. Define who may declare a site recovered, what evidence is required, and who needs corrected status. Test restore of configuration, credentials, dashboards, and alert routes. Keep evidence of the failed path and recovery decision. NIST's OT guidance matters when network symptoms can affect physical safety or availability.
Use a review checklist before expansion
Before adding a site or device type, ask whether boundary, data contract, identity, time semantics, access rule, alert action, and recovery proof are explicit. Include normal run, planned maintenance, missing dependency, duplicate event, bad clock, and limited-access operator. State which evidence is retained and who can export it.
Make the design legible to operators. A diagram naming components but not authority, freshness, and degraded behavior is incomplete. Link this decision to the sensor data pipelines guide and connected operations checklist when the service crosses network, data, and field boundaries.
A network observability field scenario
Use a dependency map that follows one operator question from the field device to the final decision. Record each handoff, the evidence available there, and the person allowed to change it. When a reading is late, the map should show whether the gateway can buffer, whether the service can label the result stale, and whether the operator may continue work. This turns a broad observability project into a sequence of reviewable boundaries.
An incident timeline should preserve more than alert timestamps. Keep the first symptom, first trustworthy signal, configuration or maintenance event, investigator hypothesis, action, and recovery proof. Distinguish what the system observed from what the team inferred. That distinction matters when a delayed message arrives after a link has recovered and appears to explain an outage that actually began earlier.
Give support a view designed for diagnosis rather than engineering exploration. It should show the affected service, site, device or path, last confirmed state, evidence age, recent changes, and safe next action. Hide secrets and unnecessary topology. A useful support view shortens the path from customer report to responsible owner without turning every support user into a network administrator.
Thresholds should be tested against representative history and then reviewed after real incidents. A single fixed latency threshold may be harmless for a batch workflow and dangerous for a control loop. Consider operating mode, maintenance window, device class, and dependency state. Keep the threshold version beside the alert so a later review can explain why the system acted differently after a change.
Network observability should also expose its own blind spots. Track collectors that are silent, sources whose clocks drift, devices that have never checked in, and paths whose data is arriving without provenance. Treat the blind spot as an operational finding with an owner. A dashboard that reports only healthy sources can create more confidence precisely when coverage is failing.
At the end of a review, make one explicit decision: expand coverage, change a signal, improve a runbook, reduce alert scope, or stop. Record the evidence and the owner for the next step. This keeps network observability tied to operating improvement instead of becoming a permanent inventory exercise.
For device-level evidence, pair this network view with NISTIR 8259A and the NIST IoT capabilities catalog when heartbeat, identity, update, and device-state signals affect the diagnosis.
Key network observability takeaways
- Start with one operational decision and bounded service path.
- Separate observation time, receipt time, freshness, and quality.
- Make every alert point to an authorized action and owner.
- Treat missing evidence as a visible state, not normal operation.
- Rehearse disruption and verify recovery with evidence.
Frequently asked network observability questions
What is the difference between monitoring and network observability?
Monitoring tells a team that a threshold or condition changed. Network observability adds enough context to explain likely causes across paths and dependencies, then guides a bounded next action. It is better when the evidence is connected to a decision, not merely because it has more data.
How much telemetry should a small team collect?
Start with the smallest set that distinguishes common failure hypotheses for one critical path. Add data when an unanswered question has an owner and defined use. Retain high-resolution evidence for diagnosis where it matters, and aggregates for capacity or trend questions.
Conclusion: network observability in practice
Network observability becomes durable when it explains a service outcome, preserves uncertainty, and gives an operator a safe decision path. Keep the boundary narrow enough to own, the signals meaningful enough to interpret, and the recovery evidence strong enough to trust.