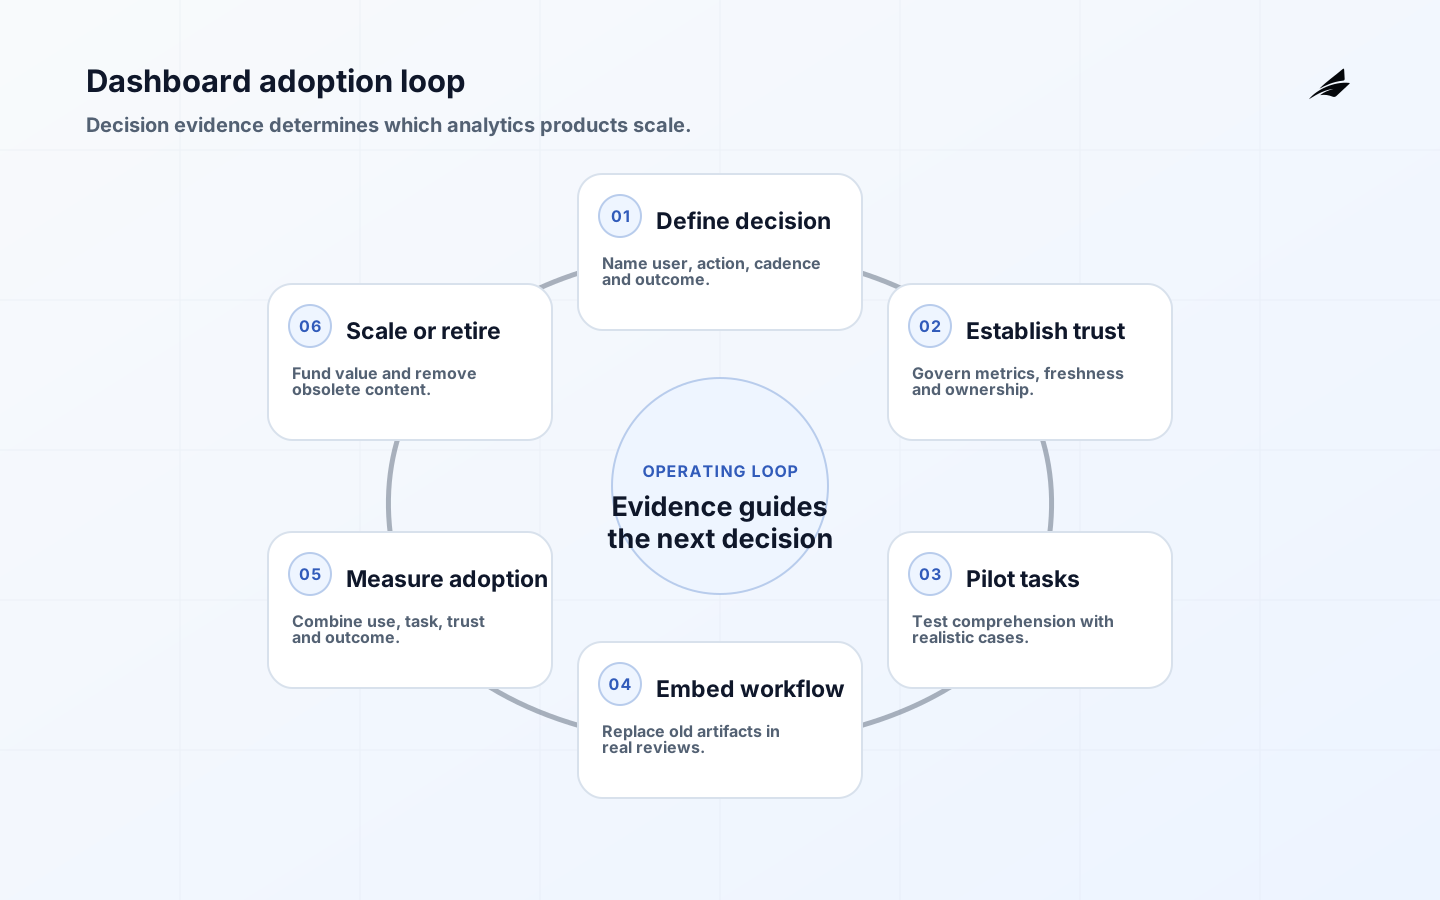
Dashboard adoption is effective, repeated use of trusted analytics to make and follow through on decisions. A view count can show reach, but it cannot prove that a dashboard changed action or replaced a weaker process. Scaling therefore means more than adding licenses and reports. It requires decision ownership, reliable metric definitions, usable performance, support, lifecycle governance and evidence that the service saves time or improves outcomes without creating a parallel reporting estate.
Use this guide with Edilec's dashboard adoption guide for IT managers, executive dashboard operations playbook and BI dashboard design guide. They connect adoption economics to architecture and day-to-day operation.
Define the decision before designing the dashboard
Name the user, decision, cadence, available actions, consequence, baseline process and accountable owner. Observe how the decision is currently made, including spreadsheets, meetings, exceptions and informal context. A sales leader choosing where to intervene needs a different product from a finance reviewer certifying close status. If no user has authority or capacity to act, another visualization will not create adoption. Define what the dashboard replaces and what remains outside it.
Tableau Blueprint's analytics strategy guidance recommends a vision, strategic initiatives, business goals, roles, responsibilities and a cadence for success measurement. Use those elements to create a one-page adoption charter. Include decision latency, current effort, trust problems, required populations and stop conditions. The charter protects the team from measuring delivery volume instead of decision value.
| Adoption layer | Question | Measure | Failure signal |
|---|---|---|---|
| Reach | Can intended users access it? | Eligible versus active users | Permission or device barrier |
| Comprehension | Can users interpret it correctly? | Task test and support questions | Conflicting definitions |
| Decision use | Does it enter the real workflow? | Decisions referencing the product | Parallel spreadsheet remains primary |
| Outcome | Did action improve the target? | Business or service indicator | Views rise without outcome change |
| Sustainability | Can it remain current and supported? | Freshness, incidents and owner load | Manual repair grows with use |
Budget total dashboard adoption cost
Include discovery, source integration, modeling, data quality, design, accessibility, licenses, compute, storage, refresh, distribution, security, training, support, monitoring and retirement. Separate one-time migration from recurring service cost. Self-service still consumes governance and platform capacity. A cheap report built on manual extracts can be expensive when analysts reconcile it every week, users debate definitions and leaders maintain a shadow spreadsheet.
Model unit economics by useful decision or active cohort rather than cost per dashboard. Estimate query and refresh demand, peak concurrency, data volume, export behavior and scheduled delivery. Allocate shared-platform cost transparently enough to guide behavior without charging teams for every exploratory query. Include a reserve for metric change and source incidents. The investment case should compare total current effort and decision loss with the proposed service, not claim all existing reporting cost will vanish immediately.
Build trust through ownership and semantic controls
For every decision-critical metric, document name, purpose, owner, grain, population, formula, time basis, source, exclusions, freshness, quality rules and limitations. Reuse governed semantic definitions where appropriate. Show freshness and filters in the product. Distinguish certified operational content from exploratory work without blocking learning. Users need one clear support route and a way to challenge data, definitions or access.

The Tableau governance guidance describes governance as controls, roles and repeatable processes that create trust and calls for iterative adaptation as adoption grows. Apply that principle independently of vendor: set content ownership, promotion, access, certification, quality, change and retirement rules. Governance should shorten the path to a trusted answer, not require a committee for every draft.
Pilot in the workflow and test comprehension
Choose one decision and a representative cohort. Prototype with realistic data, then ask users to complete actual tasks without coaching: identify a change, explain the metric, drill to evidence, choose an action and report an anomaly. Test keyboard, zoom, color contrast, mobile or wall-display use where relevant. Record wrong interpretations, not only preferences. A polished dashboard that produces inconsistent decisions is not ready for broad release.
Place the product inside the meeting, case queue, planning cycle or operating review where the decision occurs. Define a transition from prior reports and preserve a fallback during validation. Train on the decision and limitations rather than every interface feature. Recruit local champions to collect examples and questions, but keep central owners accountable for defects. Observe use after novelty fades before expanding to another department.
| Cost driver | Scaling risk | Control | Review signal |
|---|---|---|---|
| Dashboard count | Duplicate and abandoned content | Promotion and retirement workflow | Active use and owner status |
| Query volume | Warehouse contention | Caching, aggregates and budgets | Runtime, queue and spend |
| Refresh frequency | Cost without fresher decisions | Align refresh to source and cadence | Freshness versus action |
| Licenses | Seats without effective use | Cohort rollout and access review | Eligible, active and proficient users |
| Support | Analyst time becomes hidden operations | Service route and knowledge base | Volume, age and recurring cause |
Scale performance and content deliberately
Measure database execution, BI service processing, network and browser rendering separately. Google's current Looker dashboard performance guidance warns that each uncached tile can run a query and recommends limiting query-heavy elements, coordinating refresh with ETL and testing as elements are added. The exact limits are product-specific, but the principle is general: fewer purposeful views often improve speed and comprehension.
Scale with reusable semantic models, governed components, tested release pipelines, workload management and observable ownership. Segment executive, operational and exploratory workloads when their latency and concurrency differ. Publish design and performance budgets. Archive content whose owner has left, source has retired or decision no longer exists. Retirement reduces search noise, support effort and compute while making trusted products easier to find.
Measure effective adoption, not surveillance
Combine access, repeat use, task success, workflow evidence, support, trust and outcome. Microsoft's Power BI usage metrics documentation lists views, unique viewers and related measures, while noting exclusions and possible overcount or undercount. Treat telemetry as imperfect product evidence. Avoid ranking individual employees by views; low use may indicate role mismatch, leave, a seasonal decision or a better automated route.
Microsoft's adoption maturity guidance explicitly says usage statistics alone do not indicate successful adoption and frames adoption as effective behavior. Review cohorts at 30, 60 and 90 days. Ask which decisions changed, which old artifacts remain and what work users still perform outside the product. Expand only when the operating model and source capacity can support the next cohort.
Create an operating model before broad adoption
Publish who owns the analytics product, semantic model, sources, platform, access, quality response and user support. Define service hours, freshness objectives, incident severity and communication. Consumers need to know whether a blank value means zero, missing data or a delayed source, and where to report it. Assign a deputy for consequential dashboards so ownership does not disappear during leave or organizational change.
Use a release workflow with source and model tests, visual or schema checks, accessibility review, peer approval, production verification and rollback. Version metric and filter behavior. Preview material changes with decision owners and communicate effective dates. A dashboard can remain available while silently changing meaning; protect users from that failure by retaining release notes and old definitions for historical interpretation.
Design support as product research. Categorize tickets into access, interpretation, quality, freshness, performance and feature need. Track recurring causes and fix shared components instead of answering the same question repeatedly. Office hours can expose workflow gaps, but they should not become the permanent interface for undocumented metrics. Include support effort in cost and capacity planning.
Run quarterly portfolio reviews. Confirm each product's decision, owner, active cohort, source health, cost and replacement status. Merge overlapping dashboards only after understanding their different audiences and controls. Retire through notice, dependency review, archive and removal from discovery. Preserve snapshots or definitions when historical decisions require them. This lifecycle keeps adoption work focused on a coherent trusted portfolio.
Plan capacity with scenarios rather than straight-line user growth. A board meeting, month-end close or incident may concentrate far more queries than ordinary days. Load-test representative dashboards and scheduled deliveries against warehouse and BI limits, then define graceful degradation. Protect critical operational products from exploratory workloads where necessary. Review license and compute commitments after observed cohort behavior, because early adoption forecasts often overestimate simultaneous active use.
Keep an adoption decision log. Record why a cohort was added, what support and source capacity were expected, which old artifact would retire, and what evidence will be reviewed. At the review date, compare assumptions with actual behavior and cost. This prevents expansion from becoming an irreversible annual license decision and gives finance, data and business leaders a shared explanation for the next investment.
Key takeaways
- Define the user decision and action before the visual design.
- Budget data, governance, support and retirement as well as licenses.
- Make metric ownership, freshness and limitations visible.
- Test comprehension inside the real operating workflow.
- Scale semantic models, performance controls and content lifecycle together.
- Combine telemetry with task, trust and outcome evidence.
Dashboard adoption FAQ
What is a good dashboard adoption rate?
There is no universal percentage. Define the eligible cohort and decision cadence, then measure effective repeated use and outcome. A quarterly planning dashboard should not be judged by daily activity.
Should a low-use dashboard be retired?
Investigate first. It may serve a rare critical event or feed another process. If no current decision, owner or dependency justifies it, archive it through a communicated and reversible process.
Can training fix weak adoption?
Only when the product already addresses a useful decision. Training cannot repair untrusted data, unclear ownership, slow performance or a dashboard outside the workflow.
Conclusion
Dashboard adoption grows from useful decisions, trusted definitions and dependable service. Count views, but also test comprehension, workflow use, outcome and operating cost. Scale the parts that survive those tests and retire the rest. That produces a smaller, more valuable analytics estate.