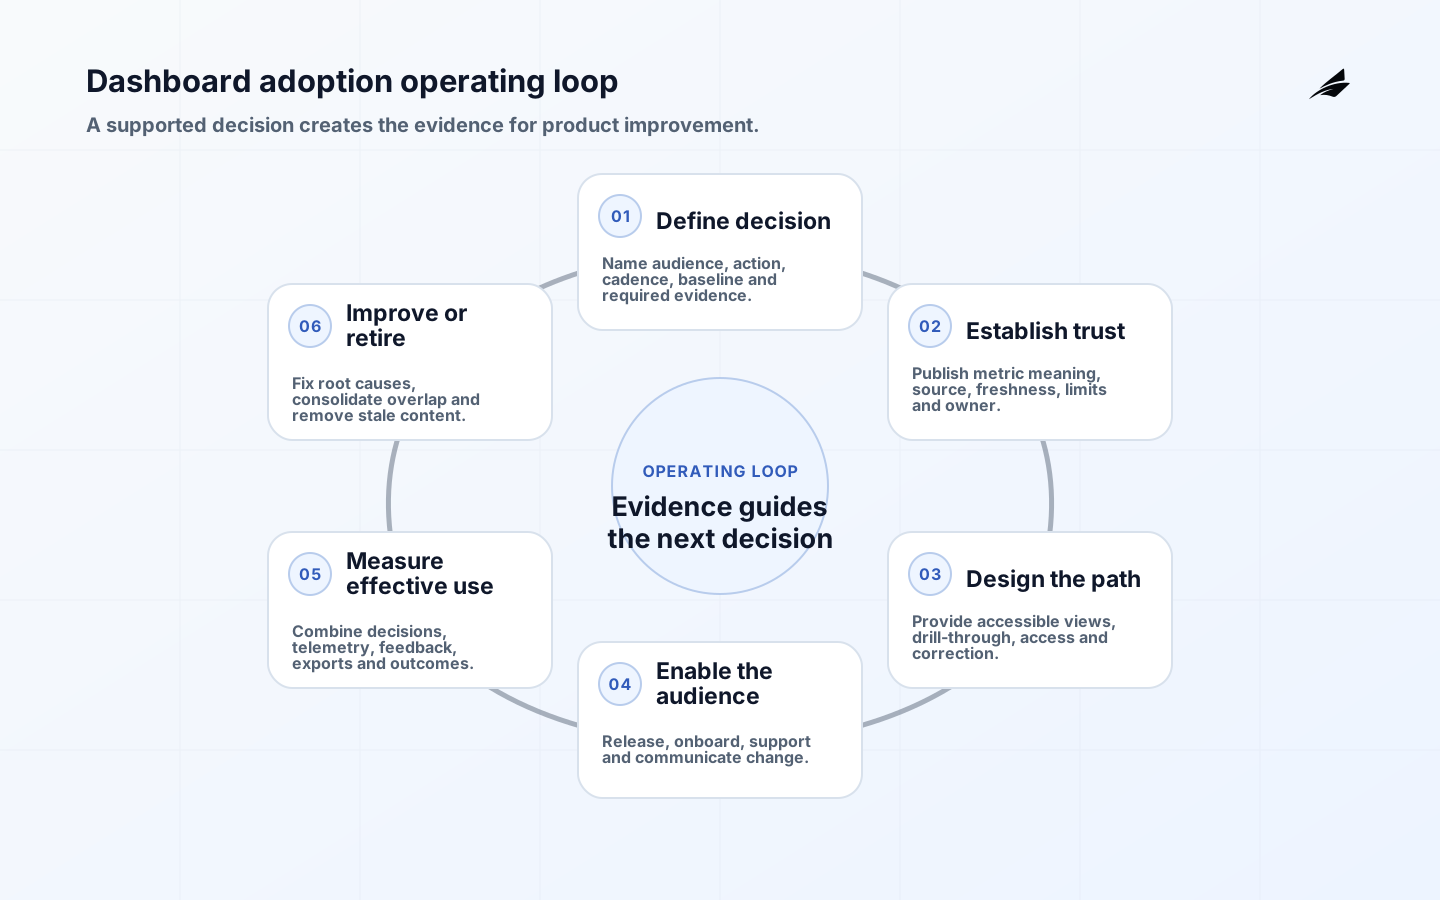
This dashboard adoption is designed for teams moving from research to an accountable delivery decision. Use the BI dashboards from first principles, executive dashboard playbook and KPI governance guide for adjacent scope, implementation and operating questions. The practical standard here is evidence: named owners, explicit boundaries, representative tests and a route to stop or correct the system when assumptions fail.
Dashboard adoption is effective, recurring use of trusted analytics in a defined decision, not a raw count of views. Microsoft’s Fabric adoption roadmap explicitly distinguishes effective adoption from usage alone and treats people, process and technology as connected. For IT managers, that means operating dashboards as supported information products with owners, access, reliability, feedback and retirement rather than treating publication as completion.
Start with a recurring decision and audience
Write a decision brief: who acts, when, on which population, using what options, and what happens when a threshold is crossed. Observe the current workflow, including exports, private calculations and messages sent to analysts. Define the minimum evidence a user needs to inspect and challenge a number. A dispatch lead may need affected jobs and promise times; an executive may need trend and accountable exception owner. Do not combine these into one crowded page merely because both mention service performance. Establish baseline delay, error or effort and a target outcome. Identify seasonal and exceptional use so low weekly traffic is not misread as failure. A dashboard with no recurring action may still be a publication, but it should not be funded or measured as an operational decision tool.
Make metrics, freshness and limitations visible
For every material metric, publish business definition, grain, source, owner, refresh expectation, exclusions and examples. The Government Data Quality Framework frames quality as fitness for purpose and emphasizes communicating limitations. Display data freshness, selected period and consequential filters before users act. Reconcile important totals with authoritative sources and investigate disputes at record level. A semantic layer can centralize governed definitions; dbt’s Semantic Layer documentation describes defining metrics on existing models. Technology cannot settle unresolved policy, so assign a steward and decision authority. Track known incidents and warn users when data is outside its objective. Trust grows when a disputed number can be traced and corrected, not when the interface discourages questions.
| Decision context | Minimum evidence | Adoption signal | Owner |
|---|---|---|---|
| Daily recovery | Queue age and affected records | Use before reassignment | Operations |
| Weekly capacity | Demand, assumptions and freshness | Scenario changed or confirmed | Planning |
| Monthly commercial | Defined stage and reconciliation | Dispute resolved from records | Revenue operations |
| Quarterly risk | Scope, trend and exception owner | Action recorded at review | Risk owner |
| Incident | Current state and last update | Coordinated response | Service owner |
Design for the user’s work and access needs
Use the vocabulary, information hierarchy and device context of the target role. Lead with exceptions or decisions, provide the necessary trend and comparison, and offer drill-through to authorized supporting records. Keep labels and visual encodings consistent. Test with realistic values, empty states, slow data and long labels, and meet applicable accessibility requirements. Preserve filter context and make exports a governed capability rather than a hidden workaround. Enforce row and object access server-side, review effective permissions and test subscriptions, links, caches and shared files for leakage. Give users a correction and access-request path in their normal support channel. Pilot by asking a user to reproduce a recent decision; every private calculation or unexplained handoff is design evidence. Attractive charts cannot compensate for missing records, stale data or blocked action.
Create a dashboard adoption operating model
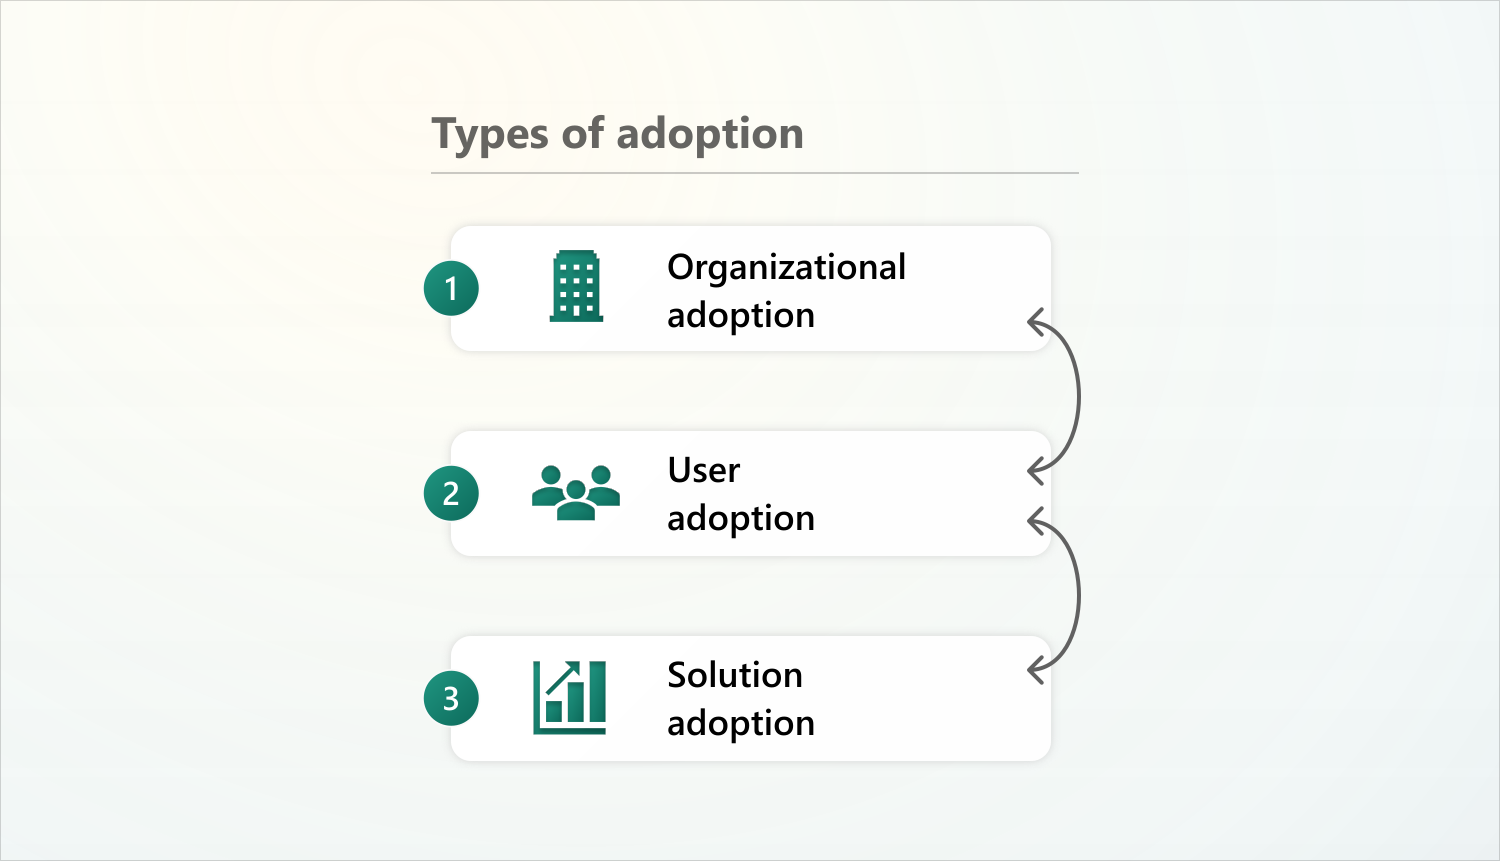
Name content owner, metric steward, platform owner, access administrator and support owner. Publish release, incident, change and retirement paths. Microsoft’s adoption maturity guidance distinguishes organizational, user and solution adoption, showing why training alone cannot repair weak governance or poor solutions. Provide role-based onboarding around real decisions, office hours or champions where useful, concise release notes and searchable definitions. Triage questions into access, data, definition, usability, performance and training so the right owner responds. Set objectives for refresh, availability and support based on decision timing. Maintain an inventory of purpose, audience, sensitivity, source, owner, last review and retirement trigger. This small service model prevents critical dashboards from depending on one analyst’s memory.

Measure effective use with mixed evidence
Instrument views, repeat use around decision cadence, filters, drill paths, performance, access failures, subscriptions and exports, while respecting employee privacy and policy. Pair these signals with interviews and decision sampling. A high view count may reflect a default home page; a low count can be healthy for a quarterly risk review. Exports can indicate missing detail, governed downstream work or lack of trust, so investigate purpose before banning them or adding pages. Measure completed decisions, reduced cycle time, fewer manual reports, dispute resolution and outcome where attribution is reasonable. Segment by audience and tenure. Microsoft’s business-alignment guidance recommends structured planning and feedback. Use evidence to simplify, train, correct or retire, not to rank employees by clicks.
| Signal | Possible meaning | Investigation | Action |
|---|---|---|---|
| Views fall | Infrequent need, failure or lost trust | Decision-owner interview | Fix, reframe or retire |
| Exports rise | Missing detail or downstream process | Sample export purpose | Add governed path |
| Disputes recur | Definition or source conflict | Trace examples | Assign authority |
| Access tickets cluster | Role design or onboarding issue | Review effective access | Simplify policy |
| Slow loads | Model or capacity problem | Profile journey | Optimize or redesign |
Release progressively and run a 30-day review
Launch to a bounded decision group with real data. Verify permissions, refresh, definitions, performance, alerts, support and rollback. Observe at least one normal and one difficult case. At 30 days, bring the decision owner, frequent user, steward and platform owner with refresh history, access failures, support themes, exports, performance and example decisions. Ask what changed, what still required calculation elsewhere and where trust broke. Choose the next action from definition correction, source quality, drill path, access, performance, training or retirement. Microsoft’s governance guidance favors iterative governance with staged rollouts for many organizations. Publish the review decision so users understand improvements and remaining limits. Repeat at a cadence based on importance and change.
Govern growth and retire stale dashboards
Review the dashboard inventory for duplicate purpose, overlapping metrics, unsupported sources, broad access, poor performance and missing owners. Require new requests to name a decision and compare existing products before approving another copy. Consolidate only when audiences and definitions truly align. Mark deprecated content visibly, notify users, archive definitions and lineage, revoke subscriptions and remove access after an announced period. Preserve records required for audit or historical interpretation. Track platform capacity and query cost by product where possible. A dashboard can be retired even if it has occasional views when those views support no approved decision or a better source exists. Portfolio governance protects reader attention, security and support capacity. Healthy adoption is not indefinite growth in report count; it is a smaller, current set of products people can trust.
Define adoption acceptance and portfolio decisions
Before broad launch, test meaning, usability, access, reliability and support. Ask representative users to complete a recent decision, explain key metrics, identify freshness and find contributing records. Test row-level permissions with allowed and denied identities, including role changes and shared links. Reconcile totals, simulate delayed refresh and confirm warnings prevent unsafe interpretation. Measure performance on typical devices and verify accessibility with keyboard, magnification and assistive technology where applicable. Support staff should route sample definition, data and access issues. After 30 days, classify the dashboard as adopt, improve, restrict, consolidate or retire. Adopt when intended users apply it effectively and operations are sustainable; improve a valuable but fixable product; restrict sensitive or consequential use; consolidate genuine overlap; retire content without an accountable decision. Record evidence, owner and next review. This prevents low traffic from triggering cosmetic redesign and high traffic from excusing unreliable data, while giving IT a defensible basis for capacity and attention.
Set review frequency from decision cadence, sensitivity and change. A daily operations dashboard needs continuous refresh monitoring and frequent owner feedback; a quarterly board view needs pre-meeting reconciliation and post-meeting action review. Trigger reassessment after source migration, metric redefinition, organizational change, access incident or repeated export workaround. Review subscriptions and cached distribution as well as workspace access. Publish material changes before the next decision cycle. Ask whether the dashboard still shortens or improves the decision and whether users can challenge it. This keeps adoption tied to current work instead of allowing familiar but obsolete reports to survive through habit.
Key takeaways
- Define adoption as effective use in a recurring decision.
- Make metrics, freshness, limitations and correction paths visible.
- Operate content, platform, access and support with named owners.
- Combine usage telemetry with observed decisions and user evidence.
- Retire stale or duplicate dashboards to protect trust and attention.
Frequently asked questions
How many users indicate healthy dashboard adoption?
There is no universal number. Compare the intended decision audience with use at the relevant cadence and evidence that the dashboard supported an action. A quarterly board dashboard and daily operations queue need different patterns.
What should happen to an unused dashboard?
Check seasonality, access, performance and whether the decision still exists. If no accountable purpose remains, archive required definitions and history, notify users, remove subscriptions and retire it.
Are exports always a sign of poor adoption?
No. Exports can support legitimate governed work, but they can also reveal missing detail, weak integration or mistrust. Sample the purpose and risk before changing the dashboard or restricting export.
Conclusion
Dashboard adoption improves when IT managers treat analytics as an operated decision service. Begin with a role and action, make meaning and freshness traceable, design secure usable paths, support the audience and review mixed evidence. A disciplined portfolio with clear retirement keeps attention on the dashboards that genuinely help people decide.