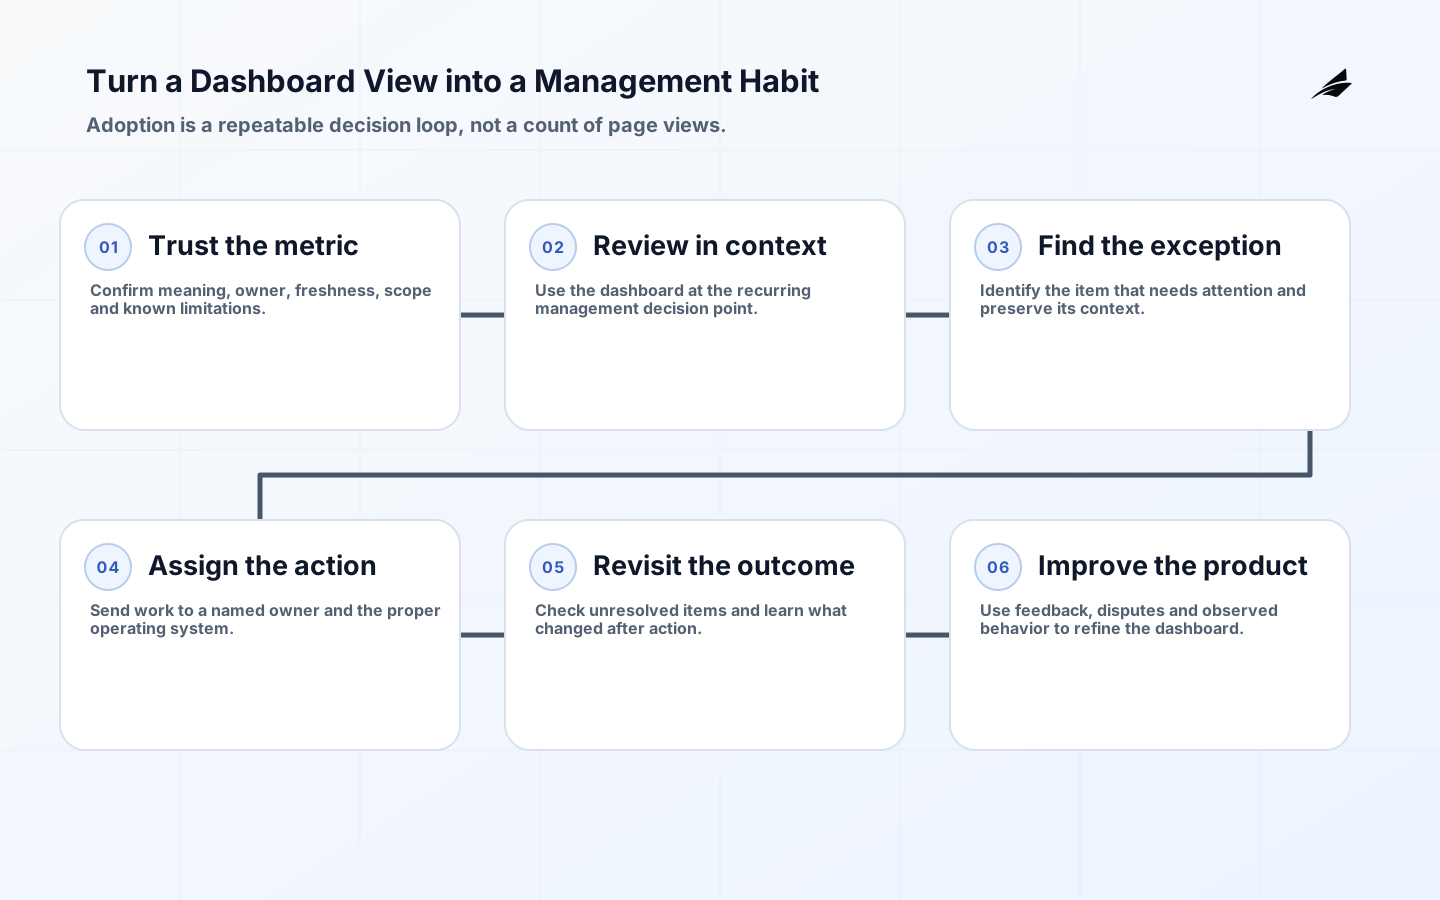
Busy managers do not adopt a dashboard because it has more charts. They adopt it when it reliably answers a recurring question, fits the meeting or decision where that question matters, and makes the next action clearer than the old workaround. Adoption therefore combines product design, metric governance, data operations and management habit. This guide presents a rollout that starts with one decision loop and grows only when evidence shows that people trust and use it effectively.
Key takeaways
- Choose a recurring management decision before choosing visualizations.
- Give every metric an owner, definition, freshness expectation and route for challenge.
- Design the first view for fast scanning, then preserve traceable detail and context.
- Embed the dashboard in an existing operating rhythm with explicit actions and follow-up.
- Measure decision use, trust and workflow improvement alongside views or active users.
Define adoption as effective use
A login or report view proves access, not value. Microsoft’s adoption guidance distinguishes organizational, user and solution adoption and notes that usage statistics alone do not establish success. For a manager, effective use means the dashboard is consulted at the right decision point, the measures are interpreted consistently, exceptions lead to owned action and the team can challenge or correct the data.

Write an adoption outcome in observable terms. For example: regional operations managers use the service dashboard in Monday review to identify overdue cases, assign an owner and revisit unresolved exceptions on Wednesday. This describes the audience, cadence, decision, action and follow-up. It can be observed without inventing a financial benefit.
| Adoption layer | Question | Evidence |
|---|---|---|
| Access | Can the intended manager reach the dashboard securely? | Entitlement and successful access |
| Understanding | Can users explain the metrics and limitations? | Scenario-based check or feedback |
| Decision use | Is the view used in the named operating moment? | Meeting artifact and action record |
| Action | Does an exception receive an owner and due decision? | Linked workflow or decision log |
| Learning | Do feedback and outcomes change the product? | Prioritized improvement history |
Start with one management decision
Interview managers about recent decisions, not desired charts. Ask what changed their mind, which exceptions consumed time, what evidence arrived too late and which spreadsheet or message they used instead. Observe an actual review meeting. Separate monitoring from diagnosis: the first view should reveal whether attention is needed; drill-through or linked detail can support investigation.
Choose a decision with a clear owner, reasonable cadence, available data and a safe action path. Avoid beginning with an enterprise scorecard that combines unrelated domains and committees. A narrow dashboard can become credible; a broad one can turn disagreement about definitions into a design backlog no manager has time to resolve.
| Candidate decision | Useful first question | Action path |
|---|---|---|
| Service operations | Which commitments are at risk now? | Assign owner, escalate or rebalance |
| Sales pipeline | Which material opportunities need a decision? | Coach, qualify, progress or close |
| Finance control | Which variance needs explanation? | Investigate, correct or reforecast |
| Delivery portfolio | Which dependency threatens a milestone? | Resolve, resequence or accept risk |
| Customer support | Which cases need management intervention? | Escalate, staff or remove blocker |
Create a metric contract before a polished view
For every measure, record business meaning, grain, formula, inclusions, exclusions, source, owner, refresh expectation, history behavior, access rules and known limitations. Decide how late-arriving corrections affect prior periods and how status is timestamped. Put definitions where users can reach them from the dashboard. A semantic model can promote consistency, but governance still requires people who resolve disagreements.
- Name the business owner who decides meaning and the technical owner who maintains implementation.
- Use stable identifiers and grain so totals can be reconciled to source records.
- Show data timestamp and material freshness or completeness warnings.
- Version definition changes and explain whether historical comparisons remain valid.
- Provide a visible feedback route for suspected data or logic errors.
Design for limited attention
The first viewport should communicate status, exceptions and context without requiring exploratory work. Use a restrained set of measures, consistent scales, direct labels and meaningful comparison. Color should carry a defined state rather than decoration, and it should not be the only signal. Avoid gauges and dense collections of tiles when position, trend or variance would communicate more clearly.
Progressive disclosure protects focus. A manager may begin with five exceptions, open one region, inspect the contributing records and then follow a link to the operating system where action occurs. Preserve filters and context across that path. Design for the actual device and meeting setup, including presentation screens and accessible keyboard or assistive use.
| Design element | Use it to answer | Failure to avoid |
|---|---|---|
| Summary state | Where is attention required? | A wall of equally prominent metrics |
| Comparison | Is performance changing or outside expectation? | Truncated or inconsistent scales |
| Exception list | Which items need action first? | Unsorted detail without consequence |
| Drill path | What explains the state? | Losing filter and time context |
| Definition panel | What does this measure mean? | Hidden logic or undocumented exclusions |
Put the dashboard inside the operating rhythm
Adoption planning should specify the trigger, facilitator, participant, decision and destination for action. If the Monday review uses the dashboard, the agenda should point to its sections and the meeting record should capture decisions. Alerts should lead to a useful filtered state, not another inbox. Where work must be executed in a case, CRM or planning system, link there rather than turning the dashboard into an ungoverned workflow tool.
Managers need an exception route when the data conflicts with operational knowledge. Label the issue, capture the affected metric and context, route it to an owner and show status. Do not let every question become a private analyst message; that pattern hides recurring defects and makes trust depend on personal access.
Run a role-based pilot
Select a small group representing the actual roles, regions and data conditions. Establish baselines for the current decision process: sources consulted, preparation effort, unresolved questions, corrections and time to assign action. During the pilot, observe use rather than relying only on surveys. Ask participants to think through scenarios and identify what they would do next.
| Pilot stage | Work | Exit evidence |
|---|---|---|
| Prepare | Definitions, access, data checks and support route | Readiness review |
| Orient | Short role-based scenario using real workflow | Users can find and interpret key state |
| Observe | Watch meetings and individual follow-up | Friction and workaround log |
| Correct | Fix material data, wording and navigation issues | Retest against scenarios |
| Decide | Expand, revise or stop based on evidence | Owned rollout decision |
Keep the pilot long enough to include the dashboard’s real cadence and at least one data-quality or operating exception. Do not coach every click indefinitely; the design must stand on its own. Preserve a manual fallback for consequential decisions until reconciliation and support are dependable.
Roll out in waves, not a broadcast
Expand by coherent role or operating unit. Each wave needs a sponsor, manager champion, access list, local metric differences, orientation, support owner and success review. Communicate what decision the dashboard supports, which old report it replaces, and which artifacts remain authoritative. Retire duplicates only after required needs are covered; otherwise users will preserve shadow versions.
- Use short scenario practice rather than a feature tour.
- Provide definitions and change notes at the point of use.
- Hold office hours around the first real operating cycles.
- Review low-use segments with managers before assuming resistance.
- Publish fixes and explain decisions on requested changes.
Measure adoption without gaming it
Platform auditing can show viewers, frequency, pages, device and performance, subject to each tool’s retention and scope. Those measures identify patterns but cannot reveal whether a decision improved. Combine usage with workflow evidence: meetings using the dashboard, exceptions assigned, unresolved questions, data challenges, repeated exports and old-report dependency. Use brief qualitative feedback to explain behavior.
| Measure | What it can show | Caution |
|---|---|---|
| Eligible-user reach | Whether intended roles have used the product | A view may be accidental or coerced |
| Return use by cadence | Whether users come back when decisions recur | Seasonal roles need a different expectation |
| Decision integration | Whether named reviews use the dashboard | Attendance does not prove understanding |
| Action completion | Whether exceptions move through ownership | Do not credit the dashboard for unrelated outcomes |
| Trust signals | Corrections, disputes and confidence feedback | Fewer reports may mean silence, not quality |
Set review questions before launch: Which role is not returning? Which metric is challenged? Where do users export and reconstruct logic? Which action has no destination? Investigate segments rather than celebrating an aggregate. A dashboard used daily for the wrong decision is not successful adoption.
Manage adoption risks explicitly
| Risk | Early signal | Response |
|---|---|---|
| Metric dispute | Meetings debate definitions instead of decisions | Use metric contract and named owner |
| Stale or incomplete data | Managers maintain parallel spreadsheets | Expose freshness, reconcile and pause affected use |
| Executive sponsorship only | Leaders request use but do not change meetings | Embed dashboard in agenda and decisions |
| Visual overload | Users ask analysts to interpret every page | Reduce first view and clarify exception path |
| Usage surveillance | Individuals fear punitive monitoring | Use aggregate, purpose-limited adoption analysis |
| Dashboard sprawl | Several reports answer the same question differently | Certify a source and govern retirement |
Example: a weekly service review
Consider a hypothetical operations group reviewing overdue customer cases. Managers currently combine emailed exports and chat messages. The first release shows open cases by agreed age band, highlights cases without an owner, provides a regional drill path and links to the case system for action. The metric contract states when the clock starts, which waiting states are excluded, the refresh time and the owner for disputes.
The pilot uses two regional managers for several review cycles. The team observes whether they can identify an exception, understand its age, assign action and return to unresolved cases. It records data challenges and exports. Expansion occurs only after source totals reconcile within the declared rules, support ownership works and the review agenda uses the dashboard. This is a planning scenario, not a claimed customer result.
Frequently asked questions
Should adoption targets be mandatory? Managers can require an agreed operating process, but forced clicks are a weak target. Measure whether the dashboard supports the decision and replace redundant processes.
How many metrics belong on the first page? There is no universal number. Include only what supports the first decision and test scanning, comprehension and accessibility with actual users.
When should alerts be added? After thresholds, ownership, cadence and action are clear. An alert without a decision route creates noise.
Should users be allowed to export? Exports may support legitimate analysis but can create stale copies. Define permitted use, protect sensitive data and inspect repeated exports as a design signal.
When can an old report be retired? After required users, definitions, history, access and workflows are covered; reconciliation is complete; and an approved fallback or archive exists.
Conclusion
Dashboard adoption is the disciplined creation of a management habit. Start with one recurring decision, make metrics trustworthy and inspectable, design for attention, pilot in the real operating rhythm and expand from evidence. Data and analytics services can provide broader context, but any delivery claim or outcome must be defined in a specific engagement.