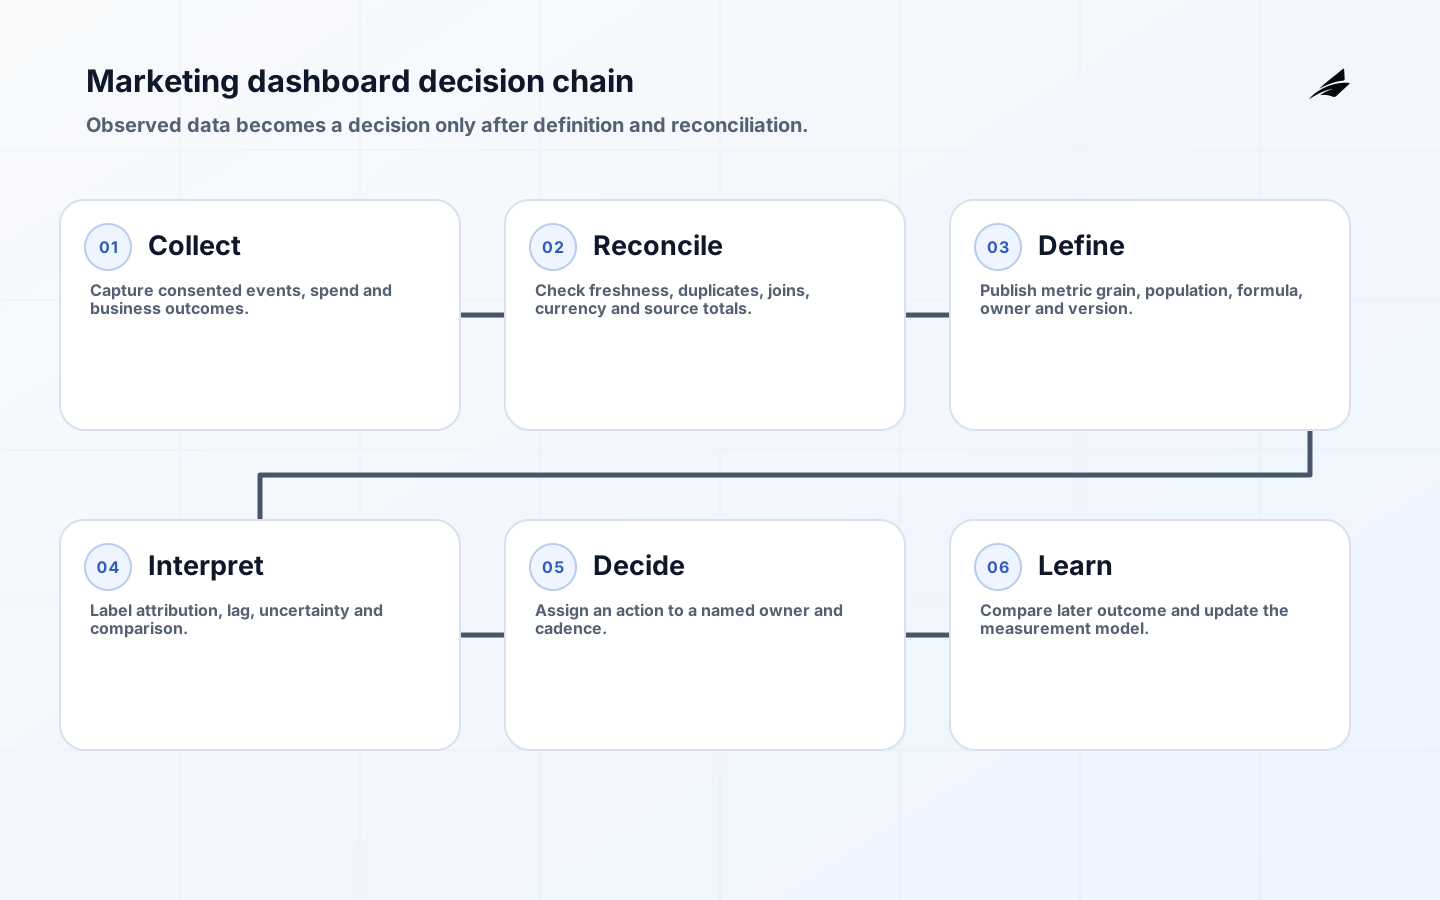
An analytics dashboard for marketing should help a team decide what to continue, stop, investigate or test. It is not a wall of channel charts. A dependable dashboard joins spend, exposure, engagement, leads, sales and retention at appropriate grains; defines every metric; shows freshness and uncertainty; and preserves the difference between observed facts and attribution models. Those qualities matter more than visual density.
This FAQ addresses practical choices behind a trustworthy marketing dashboard. The related business guide and implementation checklist cover the wider delivery process. Start with a decision and accountable owner, then work backward to data and presentation.
Which decisions should the dashboard support?
Write recurring decision statements: reallocate next week's paid budget, investigate a lead-quality decline, compare campaign cohorts after enough conversion time, or identify landing pages that create qualified opportunities. For each statement define cadence, decision owner, acceptable delay, comparison and action threshold. A daily acquisition view and a quarterly brand or retention review should not share identical freshness and attribution expectations.
Separate monitoring from analysis. Monitoring detects material movement and data failure using a small stable metric set. Analysis explores causes through segments and detailed records. A dashboard can link to analysis without displaying every dimension at once. Include a metric only when a named user knows what action it may change. Remove vanity totals that grow but do not inform a choice.
| Decision | Primary measure | Necessary context |
|---|---|---|
| Adjust campaign budget | Marginal qualified outcome per spend | Lag, saturation, audience and capacity |
| Fix funnel loss | Stage conversion by cohort | Eligibility, time window and missing events |
| Review lead quality | Accepted or won outcomes by source | Sales process and maturation time |
| Assess retention | Cohort retention or value | Acquisition period and product segment |
| Investigate data | Reconciliation and freshness status | Source coverage and pipeline incidents |
How should marketing metrics be defined?
Create a metric contract with business meaning, formula, numerator, denominator, grain, inclusion rules, time basis, currency, owner and known limitations. Define lead, qualified lead, customer and revenue from authoritative lifecycle systems rather than channel labels alone. Preserve source-specific metrics for platform optimization, but do not casually compare values that use different attribution windows or modeled populations.

Version definitions when the business changes. If qualification criteria change, mark the effective date and provide a bridge or restatement where feasible. Display denominator and population for rates. Explain whether revenue is booked, billed, collected or estimated. A metric layer can centralize calculations, but governance still requires owners to approve meaning and reconcile outputs to source records.
How should attribution be presented?
Attribution assigns credit under a model; it does not prove that a channel caused the outcome. Label the model and lookback window, and keep platform-reported, analytics-reported and business-system outcomes distinct. Use consistent campaign identifiers and preserve unattributed outcomes rather than forcing them into a convenient channel. Compare models when a decision is sensitive to their assumptions.
Use experiments, geo tests or other causal methods for high-value questions when feasible. Marketing-mix and incrementality methods need specialist design and enough data. The operational dashboard can show experiment status and measured lift, but should not blend causal estimates with observed conversions without clear labeling. Decision owners need to understand which numbers are counts, modeled allocations and experimental estimates.
| Measure type | What it can answer | Important limitation |
|---|---|---|
| Observed event | What the instrument recorded | Collection and identity may be incomplete |
| Platform attribution | How a platform assigns outcomes | Platform-specific model and incentives |
| Cross-channel model | How credit changes under shared rules | Still depends on identity and assumptions |
| Experiment | Incremental effect for tested population | Scope, power and execution quality |
| Business outcome | What entered the authoritative process | May arrive later and require reconciliation |
How can the team trust dashboard data?
Validate collection at the event boundary, then reconcile totals through the pipeline. Monitor missing identifiers, duplicate events, impossible timestamps, currency and timezone, schema drift and join loss. Compare spend to invoices or provider exports and conversions to authoritative lead or order records. Publish a freshness status and last successful load. Google notes that GA4 reports can change as daily processing and modeled attribution complete; users should not mistake intraday data for a final ledger.
Set data quality objectives by decision. A campaign alert may tolerate provisional intraday values, while monthly financial reporting requires complete reconciled data. Quarantine known-bad periods or annotate them visibly. Do not silently backfill and rewrite historical decisions. Keep incident history so analysts can explain changes and improve controls. A dashboard without a data health view encourages confident action on broken inputs.
What privacy and access controls are needed?
Collect only what supports defined purposes, configure consent and regional handling appropriately, and document identifiers and sharing. Google Analytics documentation makes clear that collection and retention choices affect user and event data; those product settings do not replace the organization's legal and privacy assessment. Apply the NIST Privacy Framework or another appropriate governance model to identify data processing, risk, control and communication duties.
Prefer aggregate views and restrict row-level customer data. Separate campaign managers, analysts, agencies and administrators by need. Audit exports and permission changes. Mask or remove unnecessary personal fields before data reaches broad reporting. Define retention and deletion across warehouse extracts as well as the source platform. Third-party sharing should be visible in the data map and contract, not discovered from tags after launch.
What should the dashboard look like?
Lead with the decision period, freshness and data health, then show a small outcome hierarchy from spend and reach to qualified and retained value. Use comparisons that match the decision: target, prior comparable period or experiment group. Provide segments as deliberate filters rather than dozens of tiny charts. Show definitions and caveats near metrics. Preserve tables for exact values and accessible alternatives to color-only encodings under WCAG.
Design drill-through from anomaly to contributing campaign, audience, creative, landing page and downstream outcome, while preserving the user's filter context. Prevent accidental comparisons across currencies, timezones or incompatible attribution windows. On mobile, prioritize monitoring and alerts rather than compressing the entire analyst workspace. Test with real decision owners and ask what action each view would cause.
How should a marketing dashboard be delivered?
Deliver one decision view end to end. Inventory its source systems, identifiers and transformations; write metric contracts; reconcile a representative period; design data health; then test the view with the owner using real decisions. Add automated tests for schema, uniqueness, accepted values, referential integrity, freshness and reconciliation. Use a separate development dataset with synthetic or minimized records. Promotion to production should version transformation code and dashboard configuration together.
Roll out with a parallel review against the current reporting process. Investigate differences instead of assuming the new stack is correct. Record accepted definition changes and annotate historical breaks. Train users to read freshness, attribution and filter context. Establish a request process for new metrics so urgent additions do not bypass governance. A small data product team can own pipeline reliability while business owners remain accountable for meaning and action.
What should be checked before publication?
Acceptance should prove invoice and business-outcome reconciliation, metric calculations at boundary cases, correct timezone and currency, missing and late event behavior, access control, export limits, keyboard use and readable labels. Test high-cardinality segments and the empty or partial-data state. Verify that links retain filter context and that no chart implies causation where only attribution is available. Publish owner, last refresh, known exclusions and incident contact.
After launch, sample decisions and ask whether the dashboard changed action correctly. Track unused views, frequent exports, repeated reconciliation differences and definition disputes. Retire measures that have no owner or action. Review privacy and retention when new identifiers or destinations are introduced. The dashboard should become simpler as the organization learns which evidence matters, not grow indefinitely with every stakeholder request.
Establish a monthly metric review separate from campaign performance. Data, marketing, sales and finance owners should examine definition changes, unmatched records, freshness breaches and disputed attribution. Approve corrections with an effective date and communicate material restatements. This keeps measurement governance from being postponed whenever the performance conversation becomes urgent and gives decision makers a clear place to challenge the evidence.
Key takeaways
- Start with recurring decisions and their acceptable data delay.
- Govern formulas, grains, populations and definition changes.
- Label attribution as a model and separate it from causal evidence.
- Reconcile spend and outcomes and expose pipeline health.
- Minimize personal data and make the interface accessible and inspectable.
Frequently asked questions
Does a marketing dashboard need real-time data?
Only when a decision benefits from it, such as detecting broken spend or collection. Many budget and quality decisions need complete cohorts and reconciled outcomes. Real-time provisional data can create noise and additional cost. Match freshness to action.
Is return on ad spend enough?
No. ROAS depends on attribution, revenue definition, margin, conversion lag and customer quality. Use it with incrementality evidence, contribution margin, capacity and retention where relevant. Keep the formula and model visible.
Should all data be copied into one tool?
A governed warehouse or semantic layer can simplify analysis, but not every raw field belongs there. Integrate the facts needed for decisions, preserve source links and own transformation contracts. Copying everything without purpose increases privacy, cost and quality risk.
Conclusion
A useful marketing analytics dashboard is a decision product. It combines governed metrics, honest attribution, visible freshness, privacy control and accessible exploration. Its credibility comes from reconciliation and ownership, not from the number of connectors.
Begin with one budget or funnel decision and trace every field to its source and definition. Publish the health and caveats beside the outcome. Once users can explain and act on that view, extend the system deliberately.