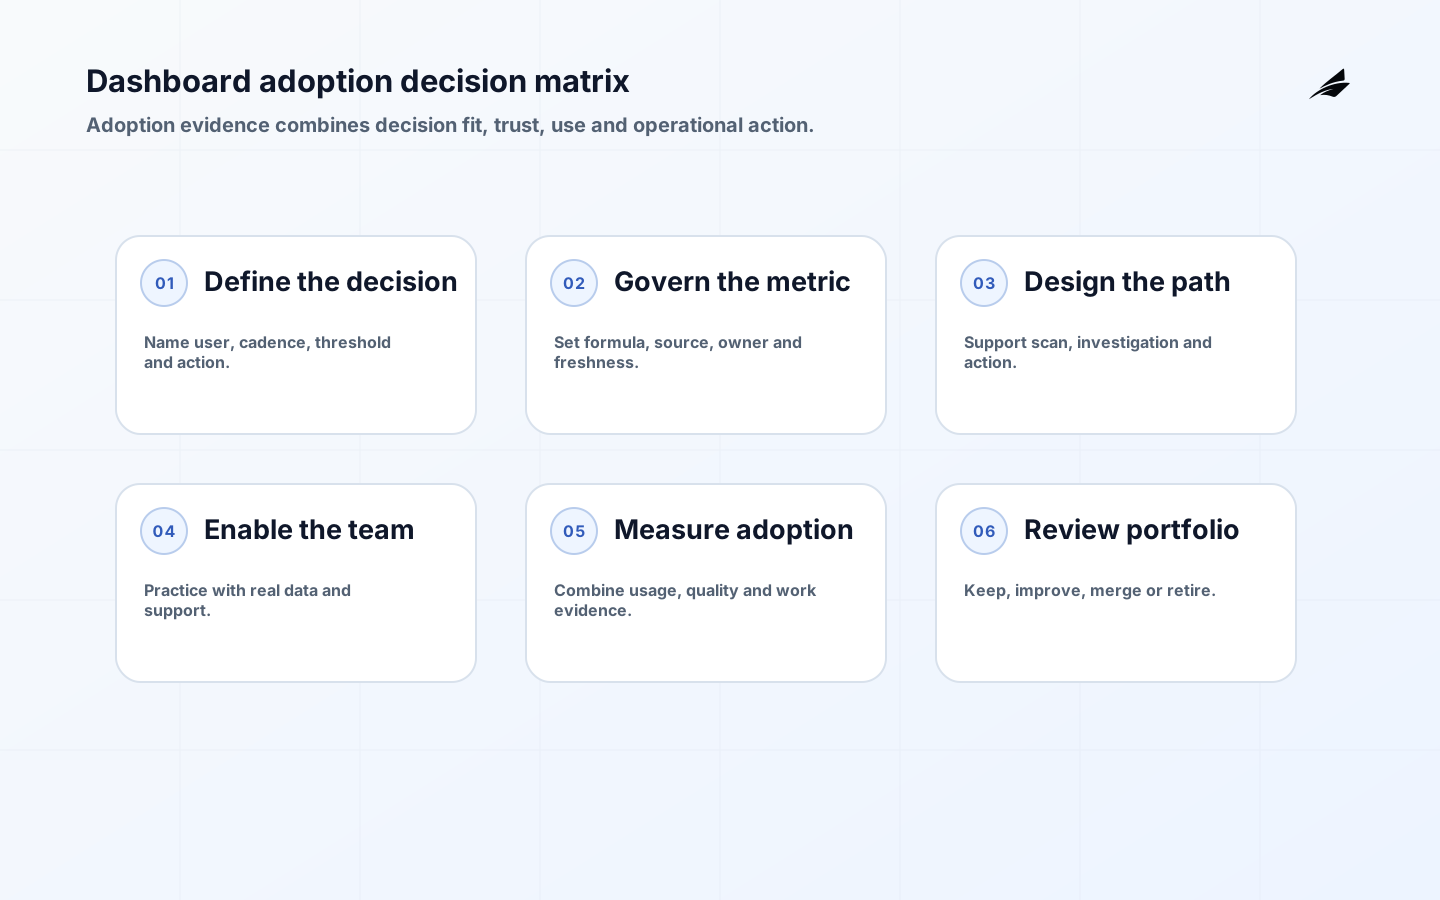
Dashboard adoption is the point at which a defined group uses a trusted view to make a recurring decision, and can recognize when the view should not be used. Logins and page views show exposure, not value. Growing teams need a light but explicit operating model for metrics, access, support and change before dashboards multiply faster than ownership. Use this guide with Edilec's executive dashboard field guide, KPI governance guide and semantic layer guide.
Start dashboard adoption with a decision
Write a decision statement: who reviews which signal, at what cadence, and what changes when it crosses a threshold. Record the questions users ask next and where they take action. A service manager may need to rebalance backlog daily; a founder may review cash runway monthly. These uses need different freshness, detail, access and interaction. Remove visuals that do not affect a decision or investigation.
Baseline the current path: spreadsheets assembled, analyst requests, meeting time, disagreement, late action and defects. Include user confidence and effort. Select one team with a repeated decision, an accountable manager and enough volume to learn. The Microsoft Fabric adoption roadmap treats adoption as a continuing combination of data culture, sponsorship, alignment, ownership, governance, enablement and support rather than a one-time deployment.
| Decision element | Question to answer | Artifact | Owner |
|---|---|---|---|
| User | Who acts on the signal? | Named audience and access group | Decision owner |
| Metric | What exactly is counted? | Definition and test cases | Metric owner |
| Cadence | When can action still help? | Refresh and review schedule | Operations owner |
| Threshold | What triggers investigation? | Rule and exception path | Decision owner |
| Action | Where is work recorded? | Linked operational workflow | Process owner |
Build metric trust and provenance
For each metric, document purpose, formula, population, grain, exclusions, time zone, source, freshness, owner and change history. Provide examples at boundaries. Separate leading signals from lagging outcomes and avoid combining values whose denominators differ. Reconcile with authoritative operational or financial records and publish known limitations. Edilec's operational metrics field guide can help connect measures to daily work.

Create a thin semantic layer or governed metric model for shared definitions. It need not be an enterprise program on day one, but revenue, active customer or open ticket should not mean something different in every report. Version transformations and tests. Show data freshness, partial loads and quality incidents in the product. A dashboard that silently displays yesterday's partial data can be more dangerous than no dashboard.
Design for scan, investigate and act
Place the decision signal first, with target, current value, trend and status expressed without relying on color alone. Support drill from summary to governed detail while protecting row-level access. Use consistent units, dates and comparison windows. Avoid dual axes and decorative precision. Test on the devices, meeting rooms and accessibility tools users actually employ. Export should preserve definitions and access controls.
Include a visible owner, last refresh, definition link, feedback route and action link. Keep alerts rare and actionable; define who receives them, deduplication, quiet hours and escalation. If a user must recreate the metric in a spreadsheet to understand it, investigate whether the dashboard lacks necessary detail, trust or workflow integration rather than labeling the user resistant.
Use proportionate dashboard governance
Classify content as personal, team, departmental or enterprise and apply review, support and certification accordingly. The Microsoft governance roadmap recommends lightweight, iterative governance co-defined with business units. Define workspace ownership, publishing rights, access groups, sensitive data, endorsement, change notice, support and retirement. Every production dashboard needs a primary and backup owner.
The developing NIST Data Governance and Management Profile reinforces that data governance connects value with privacy, cybersecurity and enterprise risk. Apply that connection locally: minimize person-level detail, enforce role access, audit sensitive use, set retention and prevent broad sharing links. Governance should enable trusted reuse, not merely slow publication.
| Adoption signal | What it indicates | Pair with | Decision |
|---|---|---|---|
| Unique viewers | Reach among intended users | Eligible audience | Target enablement |
| Repeat use | Possible workflow habit | Decision cadence | Check fit |
| Action completion | Operational influence | Linked work records | Assess value |
| Metric disputes | Trust or definition problem | Support cases | Fix governance |
| Rework outside BI | Unmet investigation need | Interviews and exports | Redesign or retire |
Roll out through a team decision loop
- Select one repeated decision and establish its baseline, owner and users.
- Agree metric definitions, data lineage, access and freshness before visual polish.
- Prototype with real users and observe scan, investigation and action.
- Pilot in the actual meeting or operating cadence with support present.
- Measure usage, action, quality, effort and unintended work over several cycles.
- Scale reusable patterns and retire superseded reports and spreadsheets.
Use office hours, champions, short role-based practice and co-development rather than generic feature training. The Microsoft user-enablement guidance describes mentoring and co-development as ways to grow self-sufficiency. Teach users how to interpret definitions, filters, freshness and uncertainty, how to drill into a signal and where to report a suspected defect.
Measure adoption without gaming it
Platform usage reports can reveal views, viewers, pages and consumption methods. Power BI usage metrics, for example, describe a 90-day report and its limitations. Use equivalent platform evidence where available, but pair it with observed decisions, action records, interviews, support contacts and quality. A dashboard opened automatically on a wall is not necessarily adopted.
Segment by intended role, location and channel. Compare repeat use with the decision cadence. Track time to answer, data defects, duplicate reports, spreadsheet rework and decisions changed. Review non-use respectfully: the dashboard may be irrelevant, slow, inaccessible, untrusted or unnecessary. Retirement is a valid outcome when a view does not justify maintenance or when the decision has moved.
Scale and retire with ownership
Create reusable metric, layout, access, quality and support patterns after the pilot proves them. Maintain a catalog with owner, audience, certification, source, last review and replacement. Notify users before material definition changes. For retirement, inspect dependencies and subscriptions, export required records, redirect links, remove access and monitor whether a harmful shadow process appears. Dashboard count should not be a maturity metric.
Run a dashboard adoption review
Choose one metric and trace it from source transaction through transformation, semantic definition, visual filter and operating action. Recalculate a sample independently and reconcile differences. Ask the metric owner to explain exclusions and the decision owner to explain the threshold. If either relies on an analyst's oral memory, improve documentation and tests before certifying the dashboard.
Observe a real meeting or shift without coaching. Record where users hesitate, change filters, open another report, ask for a spreadsheet or defer action. Check whether they notice stale data and can distinguish target, forecast and actual. Observation reveals adoption barriers that surveys miss. A polished report can still force users to perform complex mental joins across pages and tools.
Review permissions and distribution. Sample row-level access, subscriptions, exports, shared links and mobile views for current and former staff. Confirm that summarized data cannot be drilled into inappropriate detail. Examine whether usage telemetry itself contains identifiable behavior and restrict it accordingly. Remove broad workspace rights that were granted for the pilot but are not required for consumption.
Analyze cost and portfolio overlap. Include licenses, capacity, refresh, storage, support, data engineering and owner time. Identify dashboards that answer the same decision with conflicting definitions. Consolidate where it reduces confusion, but preserve role-specific views when they genuinely support different actions. Chargeback is optional; visible cost and ownership are not.
Make a keep, improve, merge or retire decision for every reviewed dashboard. For retained content, record owner, next review, user group, quality objective and support route. For retirement, contact actual users and inspect dependencies rather than relying only on view count. Measure whether the replacement path works after links and subscriptions are removed.
Review resilience of the decision path. Determine what users do when refresh fails, the semantic model is unavailable or a critical source is delayed. Display partial and stale states clearly and prevent alerts based on incomplete data. Keep a proportionate manual source for high-consequence decisions and reconcile actions taken during outage after recovery. A dashboard is part of operations only when the team can continue safely without mistaking missing data for a favorable result.
- Trace one metric from record to action.
- Observe decisions without coaching.
- Sample access, export and usage privacy.
- Review cost and conflicting overlap.
- Decide keep, improve, merge or retire.
Key takeaways
- Define adoption as trusted use in a recurring decision.
- Give every metric a formula, owner, lineage and change path.
- Design the route from scan to investigation and action.
- Pair platform usage with workflow and quality evidence.
- Scale proven patterns and retire ownerless or superseded content.
Frequently asked questions
What is a good dashboard view count?
There is no universal number. Compare unique and repeat viewers with the intended audience and decision cadence. A low-frequency board dashboard and a daily operations dashboard have different healthy patterns.
Will training fix low adoption?
Only when skill is the barrier. Diagnose relevance, trust, performance, access, workflow fit, accessibility and support first. Train users on their decisions and data, not on every feature in the BI tool.
Should spreadsheets be banned?
No. They can support analysis and planning. Identify when a spreadsheet duplicates a governed recurring metric, creates uncontrolled distribution or signals a missing feature. Replace that path deliberately and preserve legitimate flexible work.
Conclusion
Dashboard adoption for growing teams comes from a dependable decision loop, not a launch campaign. Start with the action, govern definitions lightly but clearly, design for investigation, support users in context and measure changed work. A smaller portfolio of trusted, owned dashboards will usually create more value than a large catalog optimized for views.