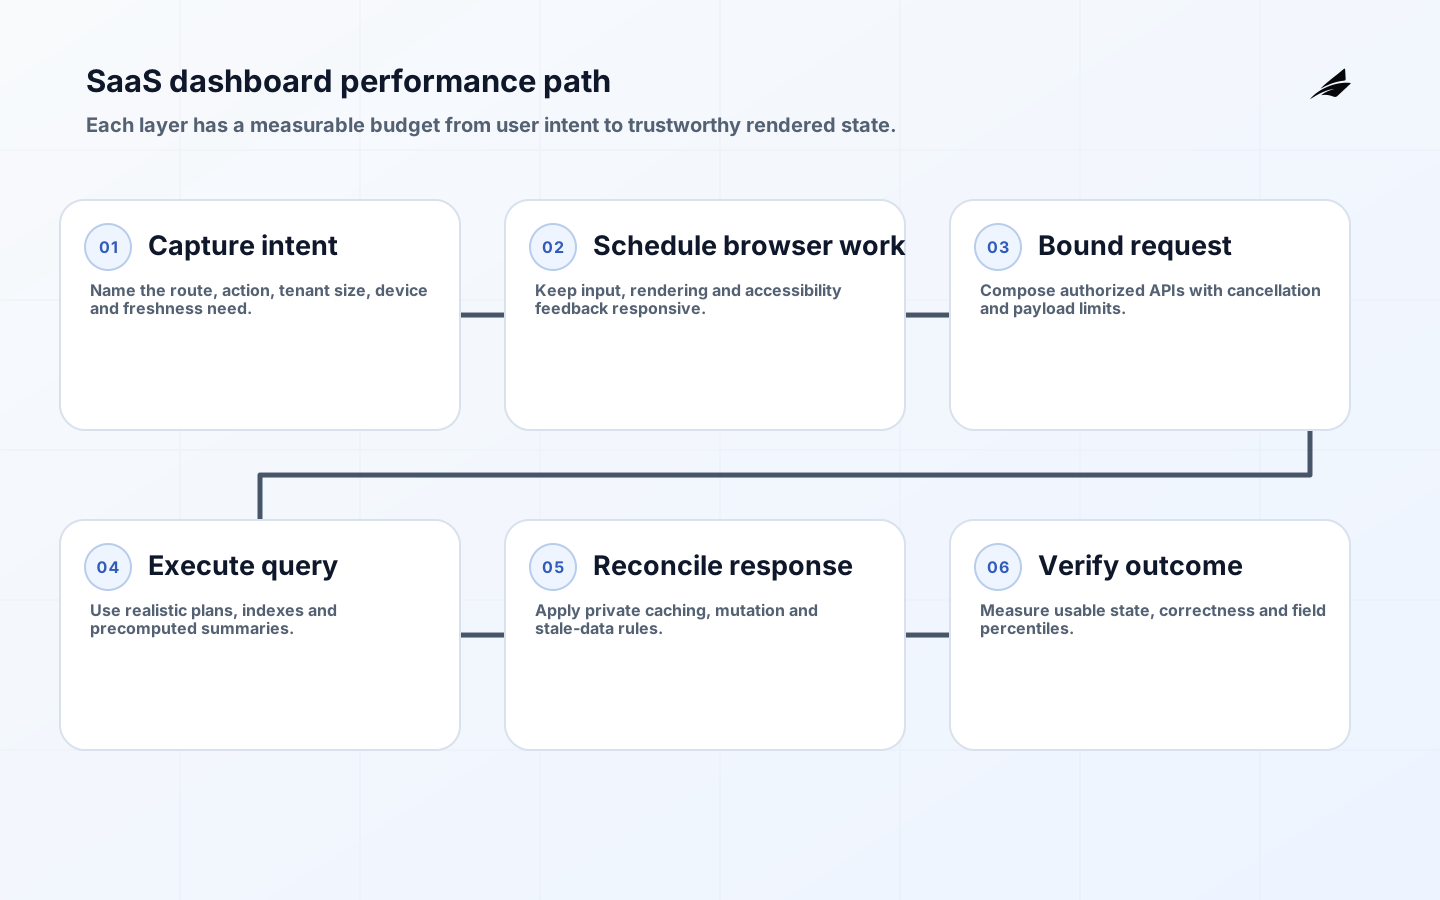
SaaS dashboard performance is the speed with which a user can reach, understand and change business state, not merely the time required to download a page. Data-heavy products combine authentication, navigation, filters, tables, charts, exports and mutations; each can be locally fast while the complete task still feels slow. The right program therefore starts with representative journeys and production evidence, then assigns latency and resource budgets to the browser, API, query and dependency layers.
This guide complements Edilec's business-app authentication lifecycle, workflow testing strategy and internal-platform design-system guide. It uses the current Core Web Vitals as broad page signals, but it also adds dashboard-specific measures such as filter-to-result time, save confirmation, stale-data age and export readiness. Those measures connect engineering changes to work users actually perform.
Define performance around dashboard tasks
Select three to five critical journeys: opening a tenant overview, changing a date range, finding a record, saving an edit and exporting a report are common examples. For each journey, record the user population, data volume, device and network profile, acceptable freshness, expected frequency and business consequence of delay. A support operator repeating a search hundreds of times needs a different budget from an executive opening a monthly report. Include keyboard and assistive-technology use so an optimization does not make the fastest visual path the only workable path.
| Journey signal | Measurement boundary | Useful decision |
|---|---|---|
| Initial dashboard ready | Navigation start to meaningful, usable summary | Whether shell, data or rendering dominates |
| Filter response | Input commit to updated result and announced status | Whether to precompute, cache or defer work |
| Record mutation | Save action to durable confirmation | Whether optimistic UI and reconciliation are safe |
| Data freshness | Source event to visible dashboard state | Whether caching meets the operating promise |
| Long interaction | Input duration and main-thread evidence | Which component or script blocks response |
Create a layered performance budget
A single page-load target hides ownership. Divide the budget into network negotiation, document and asset delivery, authentication, API latency, database work, client computation and paint. Set limits for transferred JavaScript, chart libraries, row count, concurrent requests and main-thread work as well as elapsed time. Use percentile targets rather than averages, and segment by route, tenant size, device class and geography. The Web Vitals guidance recommends evaluating LCP, INP and CLS at the 75th percentile; treat these as a floor for experience monitoring, not a replacement for business-task telemetry.
Budgets should be enforced where change happens. Bundle checks can fail a pull request, query plans can be reviewed for high-volume routes, API load tests can protect tail latency, and a release gate can compare field performance with the previous version. Leave explicit headroom for growth. A dashboard that just meets its limit with a small tenant has no resilience when records, permissions or integrations expand.
Make the data path bounded and observable
Design APIs around screen decisions rather than exposing unrestricted database-shaped payloads. Specify pagination, ordering, filter semantics, projection, currency and time-zone behavior. Return stable identifiers and a data-as-of timestamp. Expensive totals or wide joins can use separately cached summary endpoints, precomputed views or asynchronous reports. Avoid a browser fan-out in which every widget independently fetches overlapping data; compose requests at an appropriate boundary or share a query cache with clear invalidation rules.

Inspect query plans with realistic skew, not uniform demo data. Index from proven access patterns, cap interactive result sets, and cancel obsolete requests when a user changes filters. A request identifier should connect browser timing, gateway, service, query and dependency spans. W3C Performance Timeline and Resource Timing provide standardized browser evidence, while server timing and distributed traces help locate time beyond the client. Keep sensitive filter values and customer data out of general telemetry.
Cache public assets and private data deliberately
Versioned static assets are strong candidates for long-lived caching. Tenant data needs a different policy based on authorization, freshness and invalidation. RFC 9111 distinguishes private and shared caches and explains how cache keys and the Vary field affect reuse. Never let a shared cache serve one tenant's response to another. Include every material authorization and representation dimension in the design, or keep the response private. After a mutation, invalidate or reconcile affected queries and display the effective data timestamp.
Control browser rendering and interaction cost
Profile before changing framework code. Common causes include rendering thousands of rows, recreating chart options, broad state subscriptions, synchronous formatting and repeated layout measurement. Keep state close to the components that use it, memoize only demonstrated hot paths, move non-urgent work behind the interaction, and split routes or features so a user does not download every administrative tool. Virtualization can constrain DOM size for long grids, but it must preserve keyboard navigation, focus, row semantics and screen-reader expectations.
For tables, prefer server-side pagination or bounded windows when users do not need the full dataset. Workers can move suitable computation off the main thread, but serialization and coordination still cost time. Charts should aggregate to the visual resolution needed; drawing ten thousand points into a small panel rarely adds insight. Keep loading skeletons dimensionally stable, avoid focus loss during refresh and announce result counts or completion through programmatically determinable status messages consistent with WCAG 2.2.
Optimize through a measured delivery sequence
- Instrument representative production journeys and establish a segmented baseline.
- Capture a slow trace and separate network, server, query, script and rendering time.
- Fix the largest verified constraint with a reversible change and explicit acceptance threshold.
- Test realistic data volumes, permissions, keyboard operation and failure conditions.
- Release to a bounded cohort and compare field percentiles, errors and business completion.
- Record the result, retain the regression guard and move to the next constraint.
| Optimization | Best fit | Failure to test |
|---|---|---|
| Code splitting | Infrequent routes or heavy optional tools | Late chunk failure and navigation delay |
| Request composition | Widgets need overlapping authoritative data | Oversized response and coupled release |
| Query caching | Repeated reads tolerate stated freshness | Cross-tenant reuse and stale mutation |
| Virtualization | Large scrollable collections | Broken focus, print or screen-reader order |
| Precomputation | Stable expensive aggregates | Lag, rebuild and correction behavior |
| Asynchronous export | Large reports exceed interaction budget | Duplicate jobs, expiry and access control |
Accept performance with production-like evidence
Build a test dataset with small, typical and large tenants, realistic permissions, long labels, missing values and historical ranges. Run cold and warm navigation, repeated filters, concurrent widgets, failed dependencies and slow exports on representative devices. Compare browser profiles with API and query traces. Synthetic tests make releases repeatable, while real-user monitoring reveals networks, devices and interaction sequences the lab did not predict; maintain both and document differences.
Before launch, agree thresholds for critical journeys and identify who can stop or roll back a release. Verify loading, empty, partial, stale and error states. Test deep links, tab suspension, session renewal, keyboard use and assistive technology. Confirm monitoring does not add excessive script or leak tenant context. Retain an accepted trace as a future regression baseline.
After release, inspect percentiles by route and cohort alongside errors, abandonment and support contacts. A faster median can conceal a worse large-tenant tail. Annotate deployments and migrations, investigate correlated changes and give regressions an owner and expiry. Performance debt left as an unowned dashboard note becomes the next release's baseline.
Key takeaways
- Measure complete dashboard tasks as well as page-level web signals.
- Give each layer a percentile budget and protect it in delivery workflows.
- Bound query, payload, DOM and computation cost using realistic tenant data.
- Treat cache freshness, tenant isolation and mutation reconciliation as correctness concerns.
- Verify accessibility and field performance after every material optimization.
Frequently asked questions
Are Core Web Vitals enough for a logged-in dashboard?
No. They provide valuable loading, interaction and visual-stability signals, but they do not describe whether a report is fresh, a query returned the right records or a save became durable. Add custom marks and measures around important workflows, then correlate them with server and data evidence.
Should every dashboard use server-side rendering?
Not automatically. Server rendering can improve first content and reduce client work, but authenticated data, caching, hydration and infrastructure complexity affect the result. Prototype the actual route and compare field outcomes. A small server-rendered shell with well-bounded client interactions is often more useful than treating rendering mode as a universal rule.
Does real-time data require a persistent connection?
Only when the business freshness requirement justifies it. Polling with conditional requests may be simpler and more resilient for minute-level updates. Streaming helps rapidly changing operational state, but needs reconnect, ordering, authorization, backpressure and stale-state handling. State the tolerated age first, then select the transport.
Keep performance ownership after launch
Assign each critical journey to a product and engineering owner. Review budgets during feature design, because a new filter, permission rule or chart changes cost before code reaches profiling. Include performance in incident and post-release review, reserve capacity for regressions and publish a small route scorecard. When teams can connect a slow interaction to its owner, trace and customer effect, improvement becomes routine maintenance rather than an emergency optimization project.
- Review the slowest cohort, not only the global percentile.
- Re-test accepted journeys after framework, charting or data-platform upgrades.
- Remove obsolete telemetry and budgets when workflows retire.
- Make large-tenant fixtures available to every developer.
Conclusion
A fast SaaS dashboard is a controlled path from user intent to trustworthy business state. Start with journeys, budgets and production traces; then reduce the largest proven constraint without weakening correctness or access. When API shape, caching, rendering, accessibility and observability are designed together, performance becomes an operating capability the team can maintain as customers and data grow.