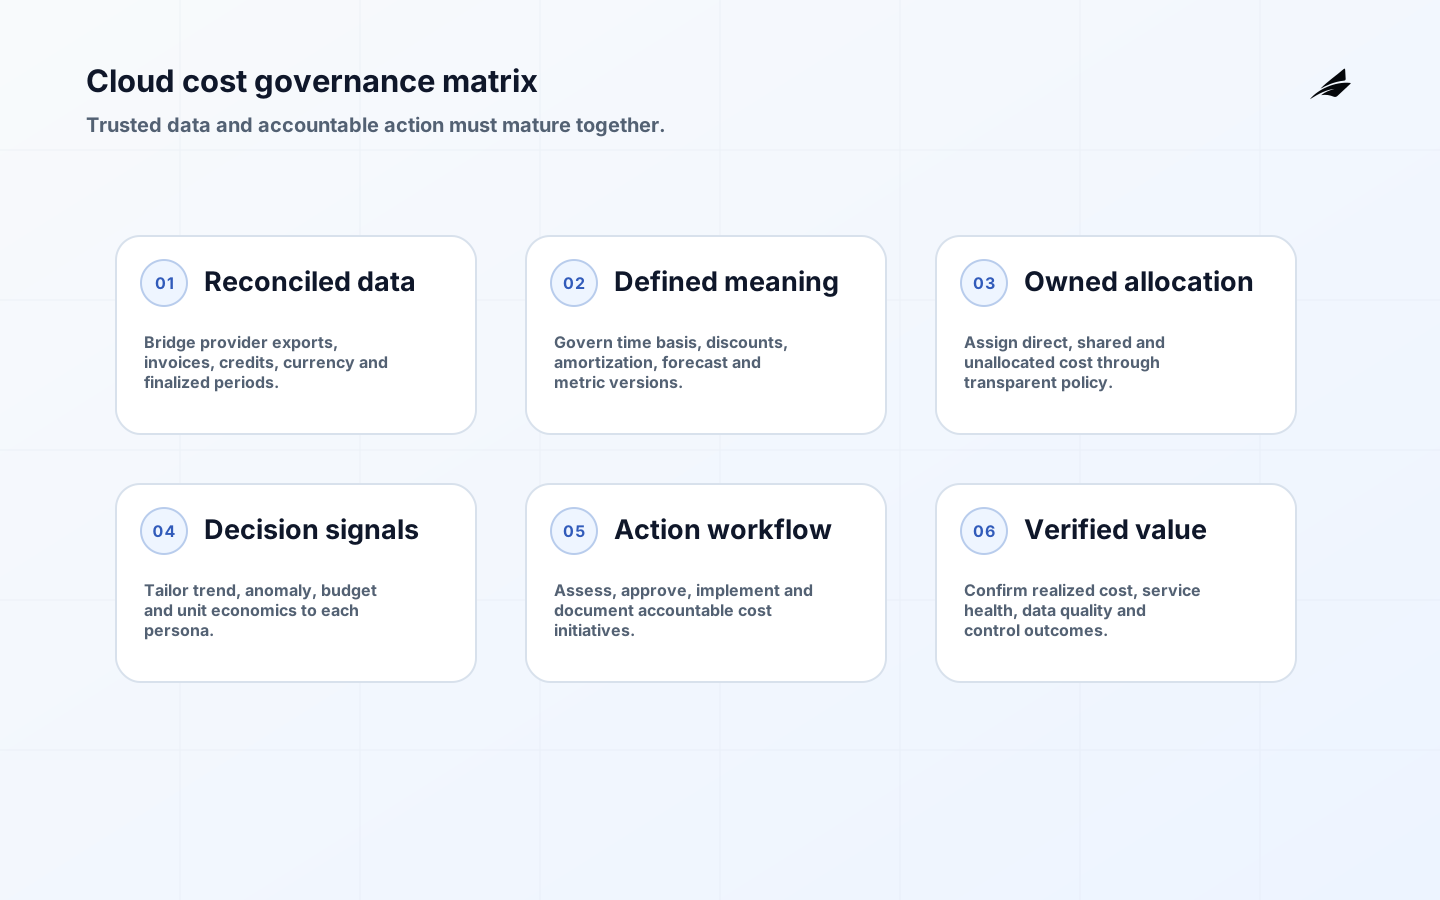
A cloud cost optimization dashboard for enterprise teams is useful only when its numbers reconcile, its allocation rules are understood and each signal leads to an owned decision. This implementation checklist addresses teams looking to build or buy an enterprise FinOps view. It covers source data, cost semantics, access, metrics, anomaly response, optimization workflows and acceptance evidence.
Use it with Edilec's enterprise cloud cost dashboard delivery plan, general dashboard implementation checklist and cloud cost dashboard FAQ. Treat visualization as the final presentation layer of a governed cost operating model.
Key takeaways
- Reconcile dashboard totals to provider invoices before optimizing anything.
- Define amortized, actual, net, list and forecast values explicitly and label every view.
- Allocate cost to accountable products and teams, with governed rules for shared and unassigned spend.
- Pair every anomaly, budget or recommendation with an owner, workflow, due date and verified outcome.
- Protect billing data and recommendation access; cost detail can reveal architecture and commercial terms.
1. Define decisions and personas
List the decisions the dashboard must support: forecast adjustment, anomaly investigation, product margin, commitment planning, resource rightsizing, environment cleanup, showback or chargeback. Interview engineering, product, finance, procurement and leadership separately. Each needs different granularity and timing. Executives need trend, variance and accountability; engineers need resource context and action evidence.

Write metric definitions and response expectations before designing charts. For each view, name owner, audience, refresh requirement, filters, sensitivity and action. The FinOps Reporting and Analytics capability describes persona-specific reporting, common terminology and outputs for forecasting, budgeting and optimization. Use that as an operating requirement, not a template for more charts.
| Persona | Primary question | Actionable view |
|---|---|---|
| Engineer | What changed and what can I safely alter? | Resource, utilization, owner and recommendation evidence |
| Product | What does this service cost per business unit? | Allocated cost, driver volume and unit economics |
| Finance | Why did actuals differ from plan? | Invoice reconciliation, forecast and variance bridge |
| Procurement | Are commitments and contracts being used? | Coverage, utilization, expiry and effective rate |
| Leadership | Where is cost risk or value changing? | Trend, material anomaly and accountable initiative |
2. Ingest and reconcile authoritative data
Ingest detailed billing exports, account hierarchy, price and credit data, commitment records and resource metadata. Preserve source files immutably and version transformations. Provider billing can be revised during a period, so support restatement and label preliminary versus finalized data. The AWS Billing and Cost Management guide illustrates native cost categories, tags, budgets, forecasts and exports; equivalent controls exist in other clouds.
Reconcile by provider, invoice, billing entity, currency and period. Explain differences caused by tax, support, credits, marketplace charges, refunds, late adjustments and currency conversion. Maintain freshness, row count, duplicate, schema and total checks. Do not publish an optimization view when the underlying period fails reconciliation; show data status visibly.
3. Define cost semantics and time
Document actual billed cost, list cost, negotiated or net cost, amortized commitment cost and forecast. Specify treatment of credits, discounts, taxes, support and shared purchases. Choose event and accounting time carefully: usage date, invoice date and export arrival date answer different questions. Make currency conversion source and rate date explicit.
Store dimensions and facts at the lowest useful grain, then expose governed measures. Avoid mixing amortized and cash views in one unlabeled total. Version metric definitions and record effective dates so prior reports remain explainable after a policy change. Test filters against known invoices and manually calculated examples.
4. Implement allocation and shared-cost policy
Create an ownership hierarchy across billing account, subscription or project, resource group, tag, service and product. Enforce metadata at provisioning where possible and track unallocated cost. The FinOps Allocation capability covers account structures, tags, labels, derived metadata and shared-cost strategies. Document every allocation rule and its accountable approver.
Treat shared platforms deliberately. Choose direct metering, proportional usage, fixed split or central funding according to the decision purpose. Publish both allocated and source cost so consumers can understand the transformation. Never hide unallocated cost by spreading it silently; route it to an owner and remediation queue.
| Data control | Validation | Failure response |
|---|---|---|
| Completeness | Expected accounts, providers and dates arrived | Hold publication or mark incomplete period |
| Reconciliation | Dashboard totals bridge to invoice | Open variance with billing-data owner |
| Allocation | Owned and unallocated percentages meet policy | Route missing metadata to account owner |
| Freshness | Latest source and transformation timestamps visible | Suppress time-sensitive anomaly claims |
| Metric integrity | Golden cases match governed calculations | Block semantic-layer release |
| Access | Persona and commercial sensitivity enforced | Revoke exposure and investigate access log |
5. Connect anomalies and budgets to workflow
Detect changes at actionable dimensions such as product, account, service and region. Use absolute and relative thresholds, expected launches and seasonality. The FinOps Anomaly Management capability emphasizes detection, responsible-party identification, investigation and documented resolution. A red chart without routing is not anomaly management.
Create an anomaly record with baseline, estimated impact, suspected driver, owner, severity, state, notes and verified resolution. Link budgets to forecast and planned changes rather than treating a monthly threshold as a surprise. Track false positives, time to owner, time to explanation and cost avoided only when counterfactual evidence is defensible.
6. Govern optimization recommendations
Combine billing with utilization and service context. CPU alone cannot establish whether a database can be downsized; memory, I/O, latency, redundancy, maintenance windows and growth matter. OpenTelemetry signals can contribute operational context, but access and retention must be governed. Present confidence, prerequisites, risk, expected saving and validation plan.
Use an initiative workflow: proposed, assessed, approved, implemented, verified or rejected with reason. Establish a pre-change baseline and verify realized cost and service health after implementation. Separate rate optimization, usage optimization, architecture change and waste removal because their owners, risks and timing differ.
7. Secure and operate the dashboard
Billing exports reveal account names, services, regions, usage patterns and negotiated pricing. Apply least privilege, row or tenant restrictions, encryption, audit logging and controlled exports. Separate administrative, data-pipeline and consumer roles. Mask or aggregate sensitive commercial terms for audiences that do not need them.
Operate source schema monitoring, pipeline alerts, data-quality objectives, semantic-model releases, access review and disaster recovery. Publish a data status panel and metric glossary. Review adoption and action completion; retire unused views. A dashboard that takes more effort to maintain than the decisions it improves needs simplification.
Acceptance checklist
- All provider and billing entities reconcile for a finalized reference period.
- Metric definitions, time basis, currency and discount treatment are approved and versioned.
- Allocation owners can explain shared and unallocated cost.
- At least one anomaly and one optimization initiative complete the workflow end to end.
- Role-based access, export controls and audit evidence pass review.
- Finance and engineering independently reproduce selected dashboard results.
Normalize multi-cloud data without erasing meaning
Create a canonical layer for common dimensions such as provider, billing account, service, region, resource, charge period, currency and cost category. Preserve provider-native columns alongside it. A normalized compute category helps portfolio reporting, but engineers still need native product, SKU and pricing detail to act. Version mappings and track unmapped spend as a quality measure.
Handle commitments, credits and marketplace charges according to provider mechanics before comparing rates. State whether shared discounts are attributed to consumers, retained centrally or shown in both views. Do not compare unit prices across clouds without workload shape, region, support, data transfer and commitment assumptions. The dashboard should make these limitations visible rather than imply false equivalence.
Reconcile each provider independently, then reconcile the consolidated layer. Test currency conversion and organizational hierarchy changes. When business units move, retain both current ownership and ownership at charge time where finance requires it. Provide drill-through from portfolio totals to source line items so disputed numbers can be investigated without rebuilding the report manually.
Add sustainability or carbon data only when methodology, coverage and decision purpose are clear. Do not combine estimates with financial cost as though both have equal precision. Label source, region, period and methodology version, and let users drill into exclusions. Use the data to support a defined architecture or procurement decision rather than decorative reporting.
Establish a dashboard product backlog governed jointly by finance and engineering. Prioritize data correctness, allocation gaps and completed actions before new visual variants. Require a user and decision for every feature. Track query cost, refresh duration and support demand so the cost-management product does not become an unchecked source of cloud consumption.
Audit recommendation conflicts. A commitment purchase can reduce rate flexibility while a migration may retire the workload; a rightsizing action can invalidate a reservation plan. Sequence initiatives and show dependencies. Finance, architecture and service owners should approve material commitments against a forecast and planned platform roadmap.
Frequently asked questions
Should an enterprise build or buy the dashboard?
Buy when connectors, normalization and workflows meet requirements; build where allocation, unit economics or decision logic differentiates the organization. Many enterprises combine a provider or FinOps platform with a governed warehouse and BI layer. Compare total operating effort, portability and control of metric definitions.
How fresh should cloud cost data be?
Match freshness to decision. Daily data often supports allocation and optimization, while anomaly response may benefit from more frequent provider signals. Label provider lag and provisional values. False precision is worse than an honest delay when invoices can still change.
How should dashboard savings be reported?
Distinguish identified, approved, implemented and realized savings. Verify realized change against a defined baseline while accounting for demand and price changes. Do not total mutually exclusive recommendations or claim avoided future cost as reduced invoice spend without clear labels.
Conclusion
An enterprise cloud cost optimization dashboard succeeds when governed data leads to accountable action. Reconcile first, define semantics, allocate transparently, route anomalies, verify initiatives and protect sensitive detail. The dashboard then becomes a shared decision surface for finance, engineering and product rather than a monthly argument over whose number is correct.