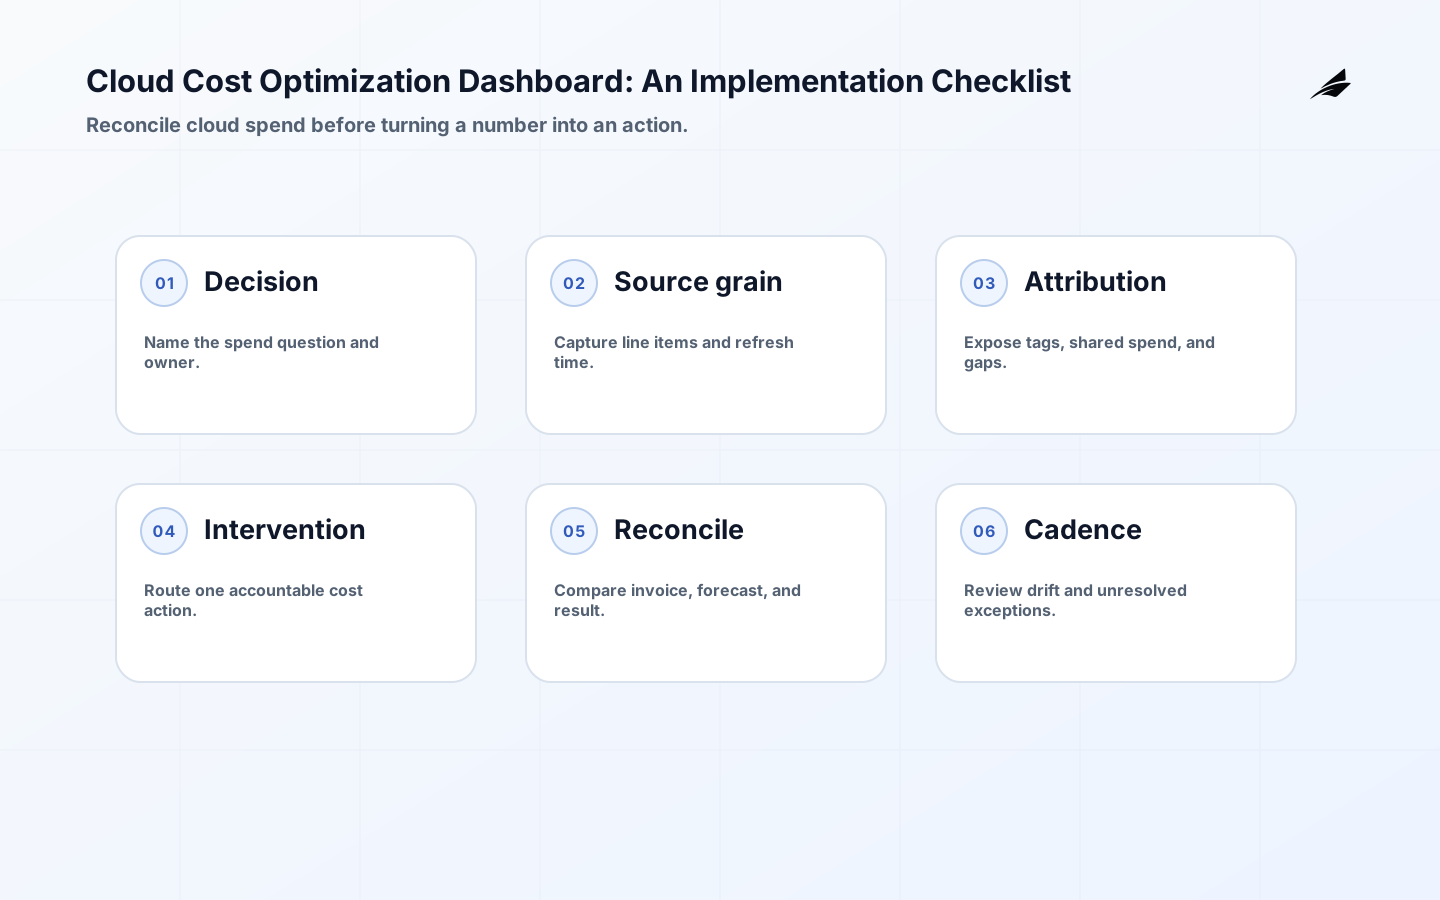
A cloud cost optimization dashboard should explain spend, assign it fairly and route a safe engineering or commercial action. It is not successful because its total resembles a provider portal. This implementation checklist covers billing ingestion, reconciliation, allocation, unit cost, recommendation confidence and savings verification across cloud providers. Use the dashboard FAQ, enterprise scope and risk plan and enterprise implementation checklist for adjacent decisions.
The FinOps Framework capabilities treat cost management as a collaborative operating practice, and FOCUS specification v1.0 standardizes cloud cost and usage fields. AWS documents the Cost and Usage Report, Microsoft explains recurring Cost Management exports, and Google describes Cloud Billing export to BigQuery. Provider data has different refresh, adjustment and allocation behavior, so the dashboard must retain source grain and reconcile each billing period.
A small-business cloud cost dashboard is dependable when product, security, and operations agree on the outcome, boundary, failure behavior, and release evidence. It is not complete at demonstration; representative users must perform the intended review, bad or unauthorized actions must be rejected, operators must explain the result, and recovery must be exercised. This guide turns those expectations into a practical model for founders, finance leads, and lean engineering teams.
For a small-business cloud cost dashboard, turn FinOps ideas into a short operating loop: collect a defensible bill, explain the largest movements, assign a next action, and confirm the result in the next closed period. Forecasting, anomaly review, allocation, and unit economics are useful only when they change a decision. Keep the first release narrow enough for one finance or operations owner to reconcile manually, then add automation where repeated review consumes time or creates avoidable error.
Define the cloud-cost questions that matter
Write the first decision as a concrete question: can the owner explain this month’s increase, approve a budget exception, or verify a cleanup? Name accounts, currencies, billing periods, discounts, taxes, shared services, and business units in scope. Set a promise such as ‘closed yesterday by 10 a.m.’ and show when it is missed. An explicit exclusion, such as marketplace charges outside release one, is safer than an unreconcilable chart.
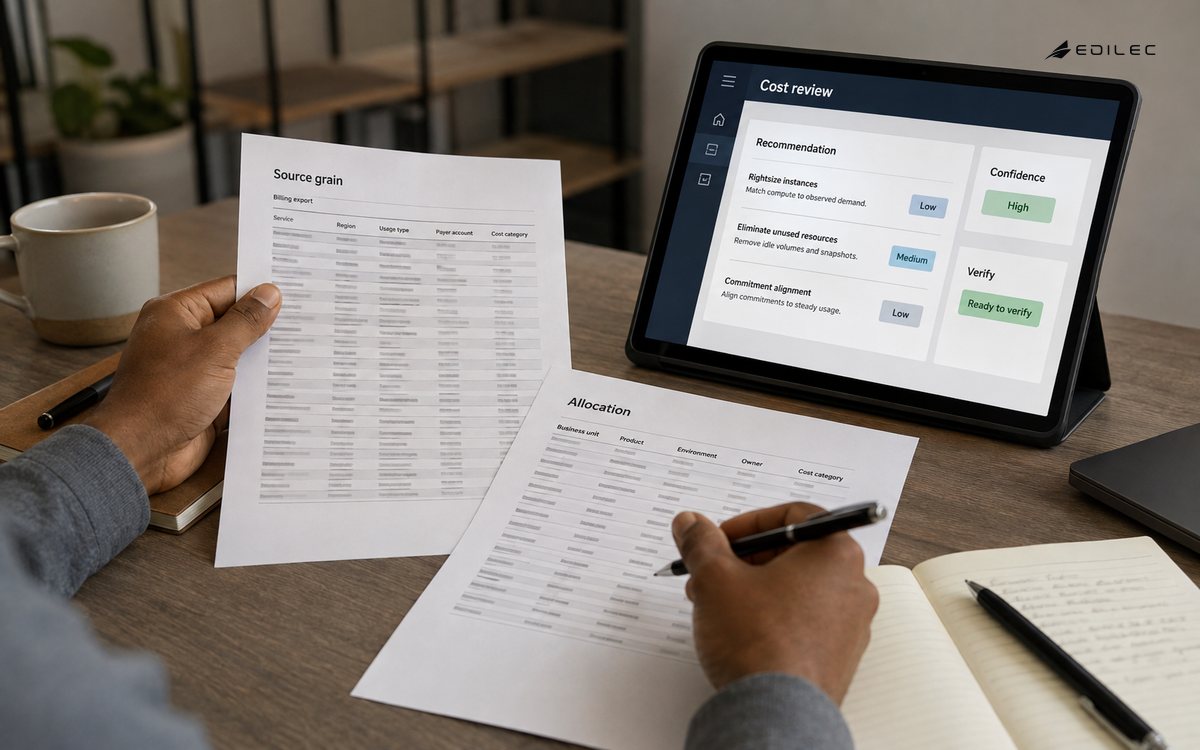
Draw the path from provider export to an owner’s action. Include finance, the account engineer, scheduled importer, mapping store, dashboard, and person who corrects classifications. Give one person responsibility for the number shown to leadership, even if another operates the pipeline. Document who can approve a commitment, change a shared-cost rule, or declare an import restored; a healthy feed can still leave a disputed bill unresolved.
| Planning decision | Evidence required | Stop condition |
|---|---|---|
| Scope | Billing accounts and dates documented | Invoice total cannot be reconciled |
| Allocation | Owner and shared-cost rules | Unallocated cost is hidden |
| Freshness | Last complete period displayed | Partial day appears as savings |
| Value | Decisions and action owners named | Dashboard is only descriptive |
Normalize provider line items for attribution
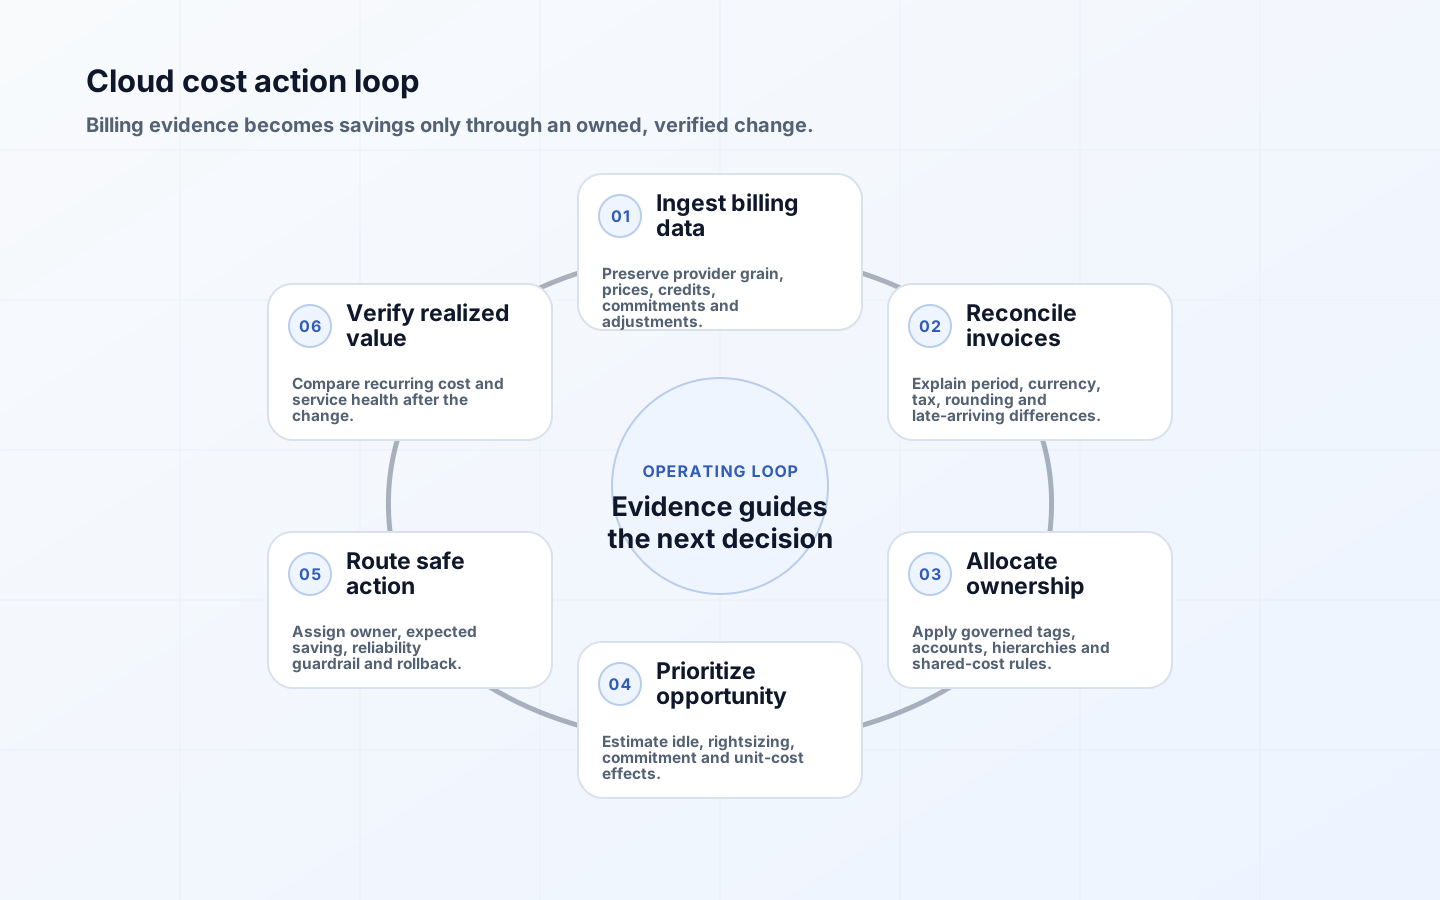
Retain provider line item, account, service, region, resource, currency, charge type, and billing-period fields before modeling. Label actual, amortized, credit, refund, tax, and forecast amounts separately. Normalize names in a mapping table but preserve the source identifier so an engineer can trace a team total to its export row. Record import batch, completion time, and revision status so a late adjustment is not mistaken for new usage.
Map a resource or account directly when ownership is reliable; place networking, observability, support, and other shared charges in named pools. Show whether the rule uses usage, seats, revenue, or an equal split. Keep ‘unmapped’ and ‘shared’ visible. When a mapping changes, preview the historical effect, require confirmation, and store old and new results so a tag correction does not silently rewrite last quarter’s bill.
Protect financial views and interpretations
Use three roles: viewers of approved totals, editors who propose ownership changes, and approvers for budgets or commitments. Mask negotiated rates when a viewer needs only service totals, but retain resource detail for incident response. Enforce roles on the API and scheduled exports; test a removed user and old session, and log mapping changes. A monthly access review beats a permission matrix nobody maintains.
Treat allocation logic like a financial policy, not a hidden dashboard setting. Give each rule an effective date, editor, reason, and review date; show whether a chart uses the current rule or a historical snapshot. If a team moves between cost centers, label the restatement so the owner can distinguish reclassification from real consumption. Alert on an actionable condition—such as an import missing by the promised time or unmapped spend exceeding a threshold—and attach the person and correction steps who will handle it.
Deliver a reconciled dashboard in measured stages
The first useful view can be modest: closed-period total, current-period estimate clearly marked as provisional, week-over-week movement, budget variance, owner coverage, and the five largest unexplained changes. Make each number drillable to a provider row or an allocation rule. Test the real import, identity, mapping, and alert path with one intentionally late file and one corrected tag. If the prototype uses hand-entered data, label it as a design sample; it has not yet proved that the dashboard can support a monthly review.
Pilot the dashboard in one account or product line for two billing cycles. At the review, choose one safe action—remove an abandoned test environment, shorten a log-retention period, or correct a storage tier—and record baseline usage, the change date, expected monthly effect, and any service guardrail. Release new allocation or alert logic behind a dated configuration change. If an exception is needed, capture its approver, expiry, affected amount, and follow-up instead of teaching the team to ignore the alert.
| Delivery gate | Minimum proof | Owner question |
|---|---|---|
| Data | Closed-period invoice reconciliation | Who signs off on differences? |
| Anomaly | Known spike detected and routed | Does alert create an owned task? |
| Optimization | Action measured before and after | Was service quality preserved? |
| Unit economics | Governed cost and denominator | Can volume explain cost change? |
Route cloud spend findings to accountable owners
An alert should state the comparison window, materiality threshold, affected owner, data completeness, and next status. A sudden bill can come from a launch, a pricing change, a backfill, or a duplicate export; require the reviewer to check deployment and usage evidence before calling it waste. Put data-quality badges beside the chart and separate ‘billing feed delayed’ from ‘spend exceeded budget.’ A small-business dashboard earns trust when it can say ‘not enough evidence yet’ instead of painting an incomplete day green.
Keep opportunity, approved change, and realized result separate. A rightsizing suggestion is not savings; a commitment is not savings until utilization supports it; and shared-service reductions cannot be claimed twice. Pair cost with an owned denominator such as order, active account, or processed job only when time windows align. After an action, check latency, errors, and customer volume alongside the invoice.
Separate forecast value from realized savings
Price the dashboard as an operating service: export storage, query or BI charges, alert delivery, connector maintenance, access reviews, finance review time, and support for disputed allocations all count. Compare that recurring cost with the savings that are realistically addressable, not with the provider’s entire bill. Start with a scheduled export and a lightweight report when the business has one cloud and few owners. Add a warehouse, multi-cloud normalization, or automated recommendations only when the saved review effort and improved decisions justify the new surface area.
For commitments, show the usage history, coverage, utilization, break-even point, term, and expiry next to the proposed purchase. A small business with seasonal traffic may value flexibility more than the headline discount. Mark the assumptions that would invalidate the recommendation—customer churn, a planned migration, a vendor change, or a large product launch—and assign someone to review them. Use a range for expected savings and disclose the unused-capacity downside instead of presenting the best case as a budget fact.
Reconcile the dashboard against the provider invoice
Close the dashboard like a small monthly book: compare the provider invoice and export totals, list credits, tax, refunds, support plans, and timing adjustments, then sample high-value resources back to source rows. Have finance and engineering each perform a review using their real role and a representative account. Deliberately test a missing export, a bad owner mapping, a denied viewer, and a corrected record. Acceptance is achieved when the team can explain the difference, repair the cause, and preserve the evidence—not merely when two dashboard widgets match.
During handoff, ask every cost owner to explain one movement, acknowledge one open mapping, and close or defer one action with a reason. Remove charts that never change a decision. Give the permanent operator the export credentials or connector ownership, rule catalogue, alert route, reconciliation worksheet, recovery steps, and known limitations. Schedule the next threshold and allocation review. The dashboard is ready for routine use when a new team member can reproduce a number without asking the original builder where its assumptions live.
After launch, review the small-business cloud cost dashboard at the same cadence as the invoice close. Compare the stated scope with accounts actually billed, inspect late or revised exports, sample allocation changes, and review whether completed actions produced the expected result without harming service. Record decisions and due dates, retire stale thresholds, and revisit the design after a new cloud service, supplier, product line, or finance policy arrives. This keeps the dashboard a maintained control rather than a report that slowly loses contact with the bill.
Key takeaways
- Design the dashboard around recurring business decisions.
- Reconcile source billing before optimizing.
- Document direct, shared and unallocated cost clearly.
- Route anomalies and recommendations to named owners.
- Measure realized savings and service impact without double counting.
Frequently asked questions
Does cloud cost data update in real time?
Not reliably. Provider exports can arrive late or be revised after the first view. Show the last complete period, import completion time, revision marker, and any missing scope so a provisional decrease cannot be mistaken for a saving.
Are tags enough for allocation?
For a five-person SaaS company, use account and subscription structure to assign the production account, resource metadata to map the API cluster, and a usage-based rule to split shared logging between products. Because tags can be missing or changed, keep an explicit shared-services pool and show allocation coverage and unmapped dollars instead of distributing uncertain charges silently.
Should a small business buy a FinOps platform?
Begin with native exports and a repeatable monthly reconciliation. Consider a platform when multiple clouds, complicated commitments, or manual review time create a measurable burden; include connector, BI, and ownership costs in that decision.
Which metric matters beyond total cloud cost?
A governed cost per order, active customer, or processed job can reveal efficiency better than a total. Pair it with denominator freshness, budget variance, unallocated share, anomaly response, and realized savings so growth is not misread as waste.
Make the dashboard answer a decision
A total-cost chart is useful only as a starting point. Decide whether the primary user needs to approve a budget, find an unowned resource, compare a unit cost, or validate a saving after a change. That decision determines grain, latency, dimensions, and permissions. Preserve provider line items long enough to reconcile the dashboard to an invoice, then publish a modeled view that explains allocation and shows where the model is uncertain.
Separate recommendation from realized saving
A rightsizing suggestion, a commitment discount, and a deleted resource have different evidence paths. Record the baseline window, the change date, the expected mechanism, and the post-change comparison. Do not claim savings from a forecast alone, and do not hide shared platform cost inside a team’s product unit economics without a stated allocation rule. A useful dashboard makes disagreement inspectable rather than turning a disputed number into a management shortcut.
Reconcile the cloud-cost dashboard
A cost-reconciliation decision example
| Check | Example question | Evidence |
|---|---|---|
| Boundary | What is deliberately out of scope? | Decision record |
| Ownership | Who can change the behavior? | Named owner |
| Failure | What happens after rejection or timeout? | Test and runbook |
| Review | What signal changes the decision? | Metric or audit |
Frequently asked questions about cloud cost optimization dashboard
What should a team decide first about cloud cost optimization dashboard?
Start with the decision: budget approval, ownership, unit economics, or savings verification. Define the source line items and the allocation rule before drawing the chart.
How should cloud cost optimization dashboard be introduced safely?
Ship one complete cost path with fresh data, visible unmapped spend, a named owner, and a correction route. Expand after users can act on the number.
What is a useful review signal for cloud cost optimization dashboard?
Review realized cost, allocation accuracy, freshness, and the actions completed. Pair the trend with a few reconciled cases so forecasts are not mistaken for savings.
Cloud cost dashboard references
Continue with Cloud Cost Optimization Dashboard FAQ: Metrics, Data and Actions, Cloud Cost Optimization Dashboard for Enterprise Teams: Implementation Checklist, Enterprise Cloud Cost Optimization Dashboard: Scope and Delivery Plan. Use the linked cost guides to compare invoice reconciliation with enterprise allocation, dashboard scope, and implementation choices.
Conclusion
A small-business cloud cost dashboard should make the bill explainable at the moment a decision is needed: source rows support the total, allocation rules expose uncertainty, alerts create owned work, and completed actions are checked against service and invoice evidence. Start with one reconciled account and a dependable review cadence, then earn complexity through demonstrated savings or reduced manual effort.