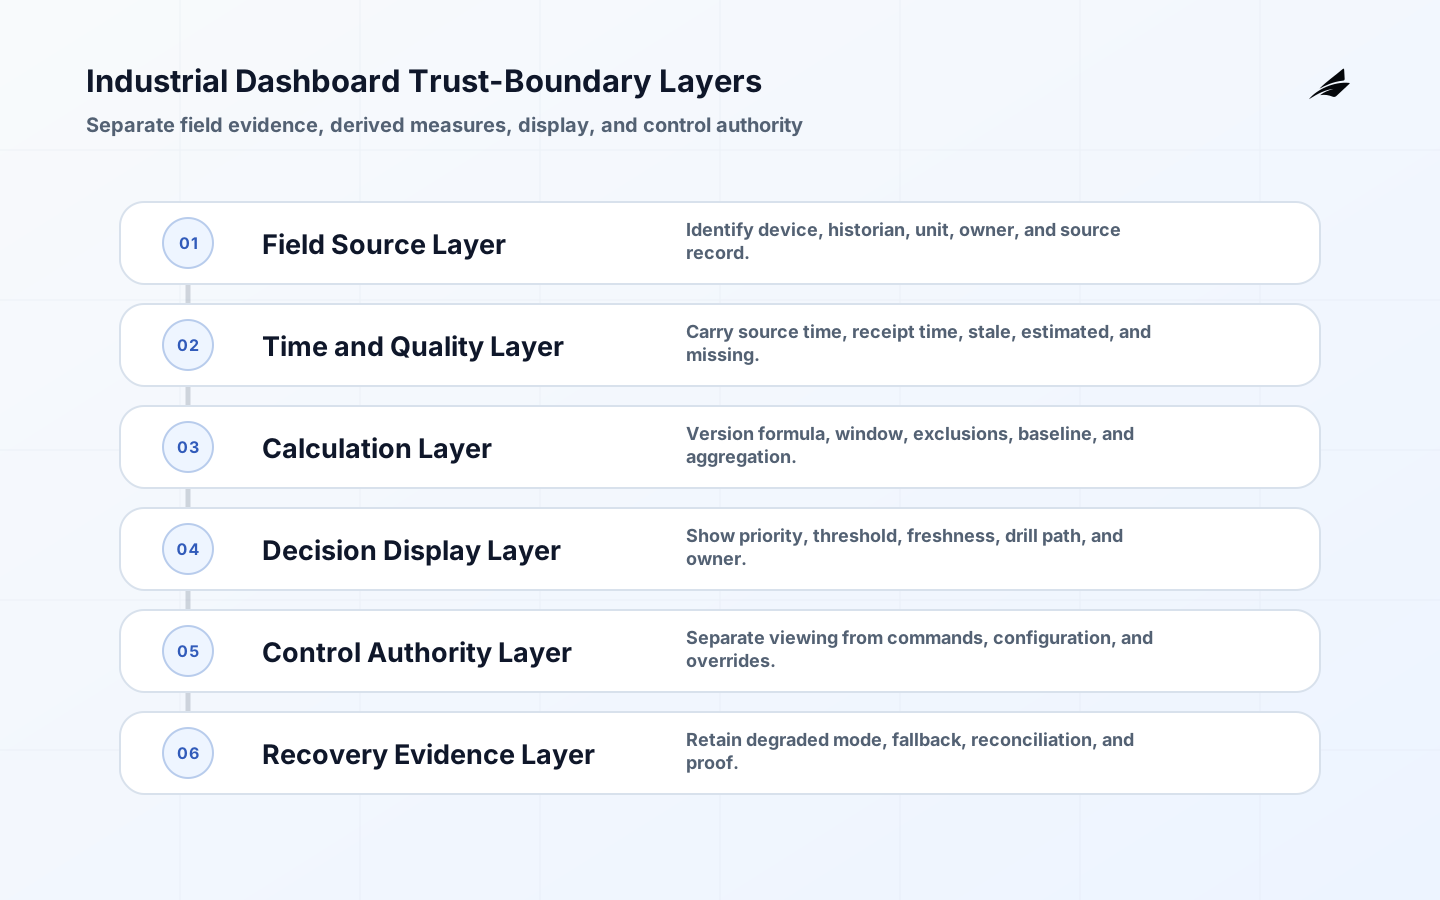
Industrial dashboards should communicate an operational decision, not merely expose data or capability. A dashboard earns trust when it shows what is happening, how trustworthy the view is, and where a user can investigate before taking action. Begin with the person who will act, the authority they have, the time available, and the evidence needed to make a safe choice. The sensor data pipeline guide is relevant because a polished interface or distributed workload cannot repair ambiguous measurement, stale records, or missing provenance. For this part of the system, name the accountable owner, supporting evidence, exception route, and next measurable check.
Define the industrial dashboards outcome and boundary
Define the metric formula, unit, aggregation window, source systems, expected delay, comparison baseline, and owner before choosing a chart. A throughput view, maintenance trend, and alarm response may draw on related data but serve different decisions. Describe the smallest useful journey from source to decision, including normal conditions and planned maintenance. Name the authoritative system for each input, its time basis, owner, quality or confidence condition, and the consequence of acting on an incorrect value. Define what is merely informative, what requires acknowledgement, and what can change an operating state. That scope prevents a convenient screen or edge service from acquiring control authority it was not designed to carry. Within this decision boundary, name the accountable owner, supporting evidence, exception route, and next measurable check.
Make industrial dashboards architecture decisions explicit
For delivery teams working on industrial dashboards, this operating decision should connect search intent, canonical URLs, rendered content, structured metadata, crawl paths, and measurable search outcomes to evidence an accountable owner can inspect. Partition collection, transformation, authorization, storage, display, and control so a fault or permission in one layer does not silently become authority in another. Give each interface a versioned contract, authenticated caller, bounded data shape, timeout, retry behavior, and retained audit evidence. Use unique identities and least-privilege access for users, services, and devices. Document the dependencies that must remain available and the declared degraded behavior when they do not. The network segmentation guide helps keep those paths constrained as the system grows. In this operating review, move beyond the operating decision only after the owner can show the accepted result, the exception path, and the signal for another review.
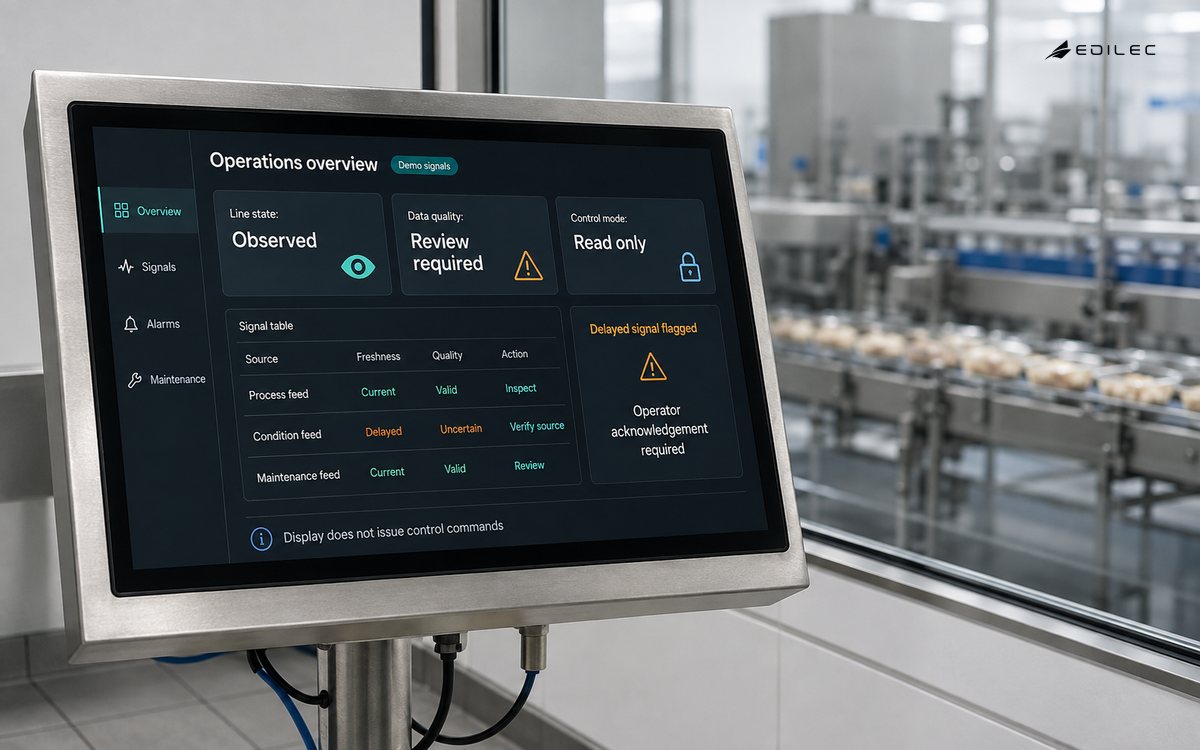
| Decision | Useful design choice | Failure to avoid |
|---|---|---|
| Respond to stop | Current state and elapsed duration | A color with no timestamp |
| Plan maintenance | Trend and threshold crossings | Averages that hide intermittent failure |
| Review shift | Actual versus target and loss category | Mixing planned downtime with loss |
Make industrial dashboards data and trust visible
In industrial dashboards, delivery teams should make the relationship between search intent, canonical URLs, rendered content, structured metadata, crawl paths, and measurable search outcomes explicit and reviewable. Preserve source time and receipt time where delay is possible. Mark missing, stale, estimated, manually entered, and substituted values rather than displaying a confident but misleading result. Store source identity, configuration or model version, and the transformation that produced a derived value. Restrict administrative actions separately from ordinary viewing or processing. When a user or workload asks for more access, require a recorded business purpose and an expiration or review point. These details make investigation faster and keep exceptional access from becoming invisible permanent design. This operating review should close the information boundary only when the result, unresolved exception, and next review condition are recorded.
Design industrial dashboards for failures and recovery
A dependable industrial dashboards design makes search intent, canonical URLs, rendered content, structured metadata, crawl paths, and measurable search outcomes visible to the owner responsible for this recovery path. Exercise loss of connectivity, a partial transaction, duplicate input, unavailable dependency, full local storage, invalid credentials, clock correction, and replacement hardware or display. Specify who decides whether to continue in a degraded mode, what evidence proves the state, and how the authoritative record is reconciled afterwards. Bound retries and queues; an unbounded retry can convert a temporary fault into noise, overload, or repeated action. Support staff need a documented fallback and a way to distinguish a healthy quiet condition from a silent collector or stale data feed. The next step in this operating review is justified when the team can trace the accepted outcome, the fallback route, and the owner of follow-up.
| Failure | Expected behavior | Unsafe shortcut |
|---|---|---|
| Late source record | Mark stale or delayed state | Show it as live |
| Display outage | Use documented authoritative fallback | Assume wall screen is always available |
| Alarm storm | Link to the governed alert path | Create a second notification system |
Operate industrial dashboards with accountable evidence
This information boundary for industrial dashboards is strongest when search intent, canonical URLs, rendered content, structured metadata, crawl paths, and measurable search outcomes can be reviewed as one operating record. Measure the health of sources, integrations, identities, latency, backlog, freshness, and configuration changes, not just the final output. Route actionable conditions to a named responder using the alert routing architecture guide, including acknowledgement and escalation rules. Retain enough event context to reconstruct a material decision while protecting sensitive operational and customer data. Review a sample of real cases with users and operators: recurring workaround, ignored alert, or confusing drilldown is evidence that a contract or workflow needs correction. Acceptance in this operating review requires a visible outcome, a bounded exception path, and a measurable reason to revisit the decision.
Roll out industrial dashboards in controlled increments
Delivery teams can keep industrial dashboards accountable by recording how search intent, canonical URLs, rendered content, structured metadata, crawl paths, and measurable search outcomes shape this operating decision. Pilot at a representative site or user group with explicit acceptance criteria. Test normal, denied, stale, unavailable, and recovery paths before expansion. Capture deployed version, configuration, affected identities, validation result, and decision maker. Use compatibility windows for data and interface changes, and rehearse rollback or alternative operation before a broad release. The pilot should reveal whether staff can run and support the system during pressure, not simply whether a demonstration can show a healthy result. For this operating review, the responsible owner should be able to explain what passed, what remains exceptional, and which signal reopens review.
Build acceptance evidence for industrial dashboards
For industrial dashboards, validate an actual shift review, maintenance investigation, and alarm response using retained source events. Ask a supervisor to explain the decision they would make, the timestamp and unit they trust, and where they would go if the display appears wrong. Include a late record, planned downtime, a manually entered value, and a data-source outage. Compare the visual result with the authoritative record. The exercise reveals whether labels, aggregation, drilldowns, and state indicators give an operator enough evidence instead of merely presenting an attractive screen. To validate this evaluation, name the accountable owner, supporting evidence, exception route, and next measurable check.
Control change in industrial dashboards
Every change to industrial dashboards needs a bounded request, an accountable owner, a versioned configuration or artifact, and a validation result that can be reviewed later. Classify changes by consequence and decide which require peer review, maintenance coordination, staged deployment, or explicit approval. Keep the prior approved state and an operational reversal or containment route. Temporary exceptions should include reason, compensating control, expiry, and removal evidence. This prevents an urgent workaround from becoming an undocumented operating standard. It also gives support and incident responders a shared reference when the system behaves differently after a release. To govern this control, name the accountable owner, supporting evidence, exception route, and next measurable check.
Assign lifecycle ownership for industrial dashboards
For industrial dashboards, the evidence behind this ownership decision should cover search intent, canonical URLs, rendered content, structured metadata, crawl paths, and measurable search outcomes. Name owners for product behavior, operations, security, source data, integrations, and vendor dependencies. The same person need not own every layer, but handoffs must be explicit: who approves access, who watches health, who updates documentation, who handles an expired credential or failed rollout, and who decides retirement. Maintain an inventory that connects the deployed component, its configuration, identity, version, support status, and location or business role. Review this inventory after replacement, change, or incident. Clear lifecycle ownership makes a distributed technical choice supportable after the original project team has moved on. Do not widen the scope from this operating review until the evidence supports the result, the recovery route, and the next operating check.
Learn from industrial dashboards operations
Use a short recurring review of real cases rather than an abstract maturity score. Look at denied requests, stale data, retries, failures, operator overrides, exceptions, and recovery time. Select one case and compare expected contract with observed behavior: what was known, who acted, what evidence was missing, and which control or instruction should change. Track the correction through implementation and retest it. This feedback loop keeps industrial dashboards aligned with changing devices, workloads, people, and suppliers while avoiding a cycle of broad redesigns that never reaches the operating teams. For this part of the system, test one expected case, one ambiguous case, and one failure with a documented recovery action.
Measure industrial dashboards without distorting it
Choose a small set of operational measures for industrial dashboards that link technical behavior to the stated outcome. Measure completion or availability alongside quality: freshness, reconciliation success, denied access, recovery time, failed change, and unresolved exception can be more informative than raw volume. Define numerator, denominator, time window, exclusions, owner, and source for each measure. Avoid a target that encourages unsafe behavior, such as closing alerts quickly without confirming recovery or maximizing throughput by discarding difficult records. Review trends with the people doing the work and investigate meaningful variation using retained event and configuration evidence. Within this evaluation, test one expected case, one ambiguous case, and one failure with a documented recovery action.
Apply industrial dashboards to one real operating case
Take one recurring case for Industrial Dashboards: Engineering Notes and write the exact path from trigger to completion. Include the human role, device or service identity, message or data contract, policy decision, authoritative record, visibility to the user, and failure fallback. Then run the case with an expected input and a deliberately awkward one: delay, duplicate, loss of connectivity, permission denial, or stale configuration. Record what the system reports, what the operator sees, and what proves the final state. This compact exercise turns broad guidance into a reviewable implementation plan and catches assumptions before they become production incidents. When implementing this part of the system, test one expected case, one ambiguous case, and one failure with a documented recovery action.
Key takeaways
- Design industrial dashboards around a specific decision and accountable owner.
- Show data quality, freshness, authority, and operating context with important output.
- Separate observation from privileged configuration or control actions.
- Test degraded behavior and preserve evidence that proves recovery.
- Review industrial dashboards against a real exception each cycle, then document and retest the correction before relying on it at broader scale.
Frequently asked questions
How many metrics should one dashboard contain? Only those needed for the named decision and immediate verification. Should KPIs be calculated in the browser? Prefer governed calculations with inspectable formula and time window. Can a dashboard issue commands? Only with separate authority, confirmation, interlocks, audit, and failure handling. Before releasing this part of the system, test one expected case, one ambiguous case, and one failure with a documented recovery action.
Conclusion
Industrial dashboards are dependable when their evidence, trust boundaries, and failure behavior are visible to the people who rely on them. Keep the first scope narrow, validate real operating cases, and use those cases to improve the contract before scaling. While operating this part of the system, test one expected case, one ambiguous case, and one failure with a documented recovery action.