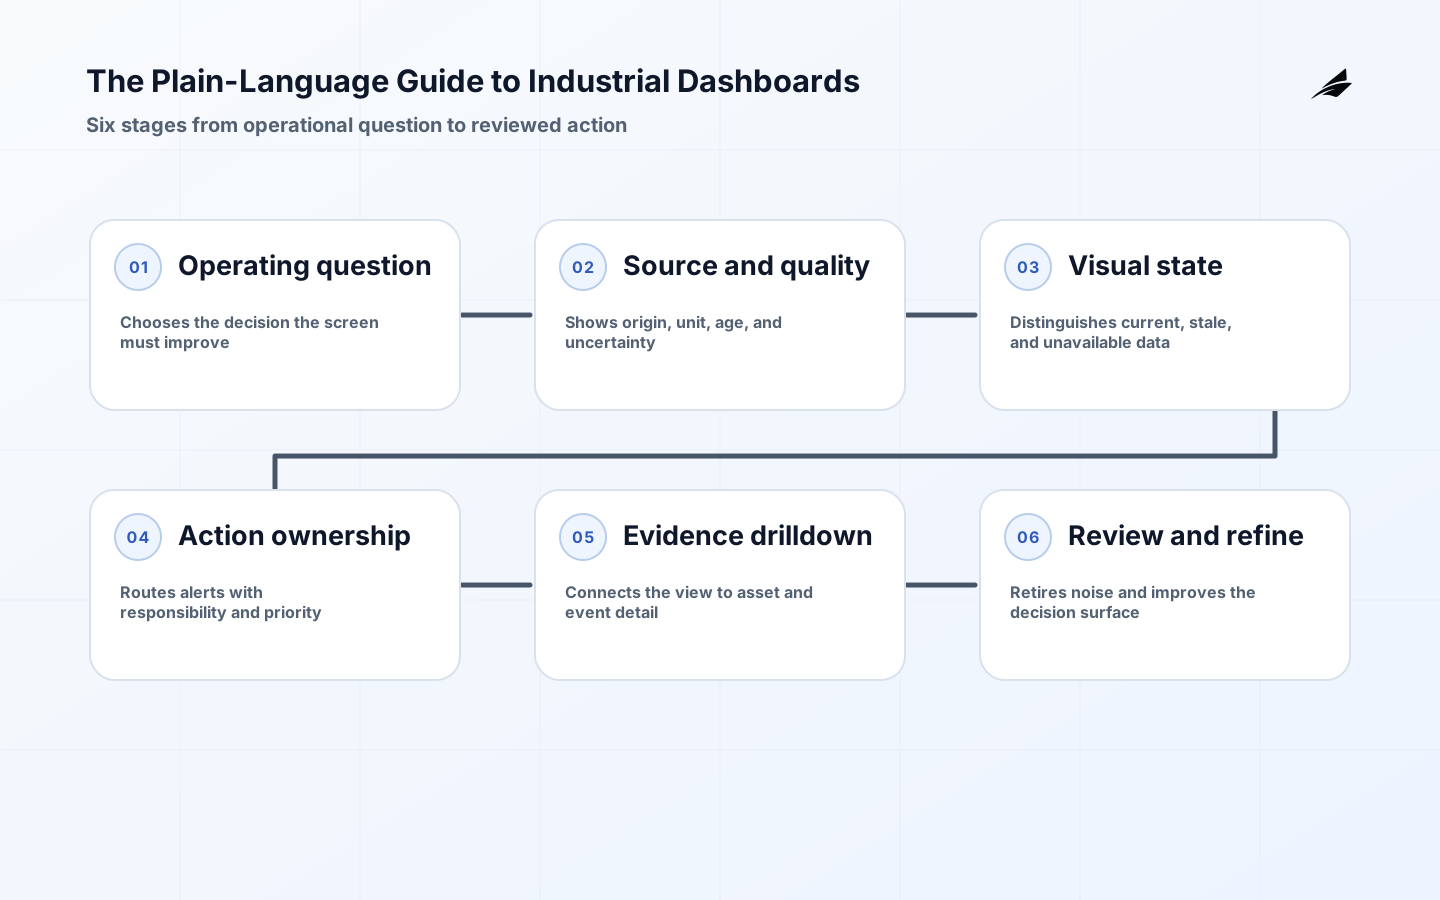
An industrial dashboard is an operating choice for engineering teams and operations supervisors, not a product label. In a connected environment, the useful question is whether it helps people make a timely, defensible decision when devices, networks, and dependencies are imperfect for industrial dashboards. Industrial dashboards turn live and historical operational data into a shared view that helps a person decide what needs attention now. Begin with the real work: name the decision, the accountable owner, the evidence they need, and the safe action when that evidence is late or disputed for industrial dashboards.
What Industrial Dashboards Mean
In plain language, industrial dashboards turn live and historical operational data into a shared view that helps a person decide what needs attention now. The distinction between a technical capability and an operational promise matters. A capability can be installed; an operational promise must survive shift changes, supplier maintenance, partial outages, and ordinary human error for industrial dashboards. Describe the business or safety consequence first, then identify the data, interface, and authority needed to support it for industrial dashboards. The phrase becomes useful when it answers a concrete question rather than decorating an architecture diagram for industrial dashboards.
For industrial dashboards, the visible state must answer more than whether a value is red or green. Put the engineering unit, source timestamp, data-quality flag, comparison window, and owning role beside measures that change a shift decision. Separate a process condition from a data-collection failure; a flat trend can mean a stable asset, a frozen gateway, or an unavailable historian. Alarm text should state the affected asset and expected first response. This approach lets an operator judge confidence quickly instead of treating a polished display as proof.
| Operating question | Design answer | Evidence to retain |
|---|---|---|
| What job is being improved? | Name the workflow, response window, and accountable owner during a dashboard decision review. | A current workflow map and agreed success measure — during a dashboard decision review |
| What must be true to act? | Use attributable data inside a known authority boundary during a dashboard decision review. | Source, time, identity, quality, and approval context — during a dashboard decision review |
| What changes when a dashboard dependency fails? | Show a degraded state and route it to a person who can decide during a dashboard decision review. | Failure test, escalation path, and recovery record — during a dashboard decision review |
| How will operators know the dashboard works? | Review operational signals instead of launch completion during a dashboard decision review. | Stale tiles, unacknowledged alarm age, dashboard load time, drill-down use, and recurring threshold overrides |
Architecture That Survives Real Conditions
A practical industrial dashboards architecture starts with linking every measure to its source, timestamp, unit, quality state, threshold owner, and drill-down path. Draw the journey from device or source through gateway, service, storage, and user action for industrial dashboards. Mark which component is authoritative, which values may be cached or estimated, what identity is used, and where human approval is required for industrial dashboards. These details are less glamorous than platform selection, but they expose dependencies before those dependencies become outages or unsafe workarounds for industrial dashboards.
The failure to guard against is straightforward: a tidy screen can still mislead when it hides stale data, mixes incompatible time windows, or gives every alarm equal weight. Design inconvenient cases before scale makes them harder to change. Define a known-safe behavior, give users a visible indication that the system is degraded, and rehearse how state is restored or reconciled for industrial dashboards. OT-adjacent work adds particular constraints because availability, safety, and reliability may matter differently than they do in ordinary business software for industrial dashboards.
Scope the First Release
Start with one bounded industrial dashboards workflow. Specify the actor, input, decision, output, exception path, and recovery check in plain language for industrial dashboards. A narrow first release creates a baseline for latency, accuracy, operator effort, and failure recovery for industrial dashboards. It also gives security and operations teams something concrete to review. Expand only when the first path is understood, supported, and used; a broad platform promise is not evidence of operational value for industrial dashboards.
- List the real assets, people, records, and approvals involved in industrial dashboards.
- Write normal and degraded behavior before choosing an implementation detail during a dashboard decision review.
- Keep source, time, quality, and ownership visible at consequential actions during a dashboard decision review.
- Use versioned configuration or contracts for changes that affect operations during a dashboard decision review.
- Exercise an exception path with the team that will support it during a dashboard decision review.
- Review recurring friction before adding a second workflow during a dashboard decision review.
Controls, Ownership, and Change
Every consequential industrial dashboards change needs a named owner, a review point, and a reversible path. The change record should capture the reason, affected assets, configuration or contract version, approver, implementation window, verification result, and rollback condition for industrial dashboards. That creates a useful history for the next person on call. It also helps distinguish a planned behavior change from a fault, which is often the first step toward faster restoration for industrial dashboards.
| Risk pattern | Control to build | Review signal |
|---|---|---|
| Unknown current state | Expose freshness, quality, and source identity next to the decision during a dashboard decision review. | Records that are stale, missing, or unowned — during a dashboard decision review |
| Uncontrolled change | Use versioned configuration, approval, and tested recovery during a dashboard decision review. | Changes without verification or an accountable requester — during a dashboard decision review |
| Ambiguous authority | Separate observation, recommendation, and irreversible action during a dashboard decision review. | Actions that bypass the intended review boundary — during a dashboard decision review |
| Hidden dependency failure | Test degraded behavior and document the support handoff during a dashboard decision review. | Exception age, failed retries, and recovery duration — during a dashboard decision review |
Measure Operational Trust
Use metrics that reveal whether the workflow is trustworthy, rather than merely whether a component is online for industrial dashboards. For industrial dashboards, track stale tiles, unacknowledged alarm age, dashboard load time, drill-down use, and recurring threshold overrides. Pair quantitative signals with a short review of actual exceptions: what happened, what evidence was present, where the team hesitated, and whether the recovery rule was clear for industrial dashboards. This combination exposes the gap between nominal availability and operational usability and prevents an SLA or dashboard from becoming a substitute for understanding work for industrial dashboards.
Related Connected-System Decisions
Industrial dashboards are easier to assess alongside related systems. Industrial Dashboards: Engineering Notes offers a focused companion view; Sensor Data Pipelines: Common Mistakes and Practical Fixes covers a dependency that commonly shapes design choices; and Alert Routing: Architecture Guide helps frame an operating consequence. These are connected choices, not a shopping list. The right design is the one that leaves operators with clearer authority and stronger evidence when the normal path stops being normal for industrial dashboards.
Authoritative References for operator-facing dashboards
Industrial dashboard choices should be checked against NIST SP 800-82 Rev. 3: Guide to Operational Technology Security, NISTIR 8259A: IoT Device Cybersecurity Capability Core Baseline, NIST SP 800-207: Zero Trust Architecture, and NIST SP 800-213A: IoT Device Cybersecurity Requirement Catalog. Together they support careful handling of OT data, identity, interfaces, and device requirements. Use vendor manuals and site procedures to confirm tag meaning, display constraints, safety roles, and the response expected for each alarm.
Design the dashboard around an operator decision
An industrial dashboard should answer a small set of operating questions quickly: what changed, how certain is the evidence, who owns the next action, and what should happen if the signal is stale? A screen that displays many gauges can still be operationally weak if units, time windows, quality codes, or asset identity are unclear. Start with one user and one decision, then show the minimum context needed to act without opening several unrelated systems.
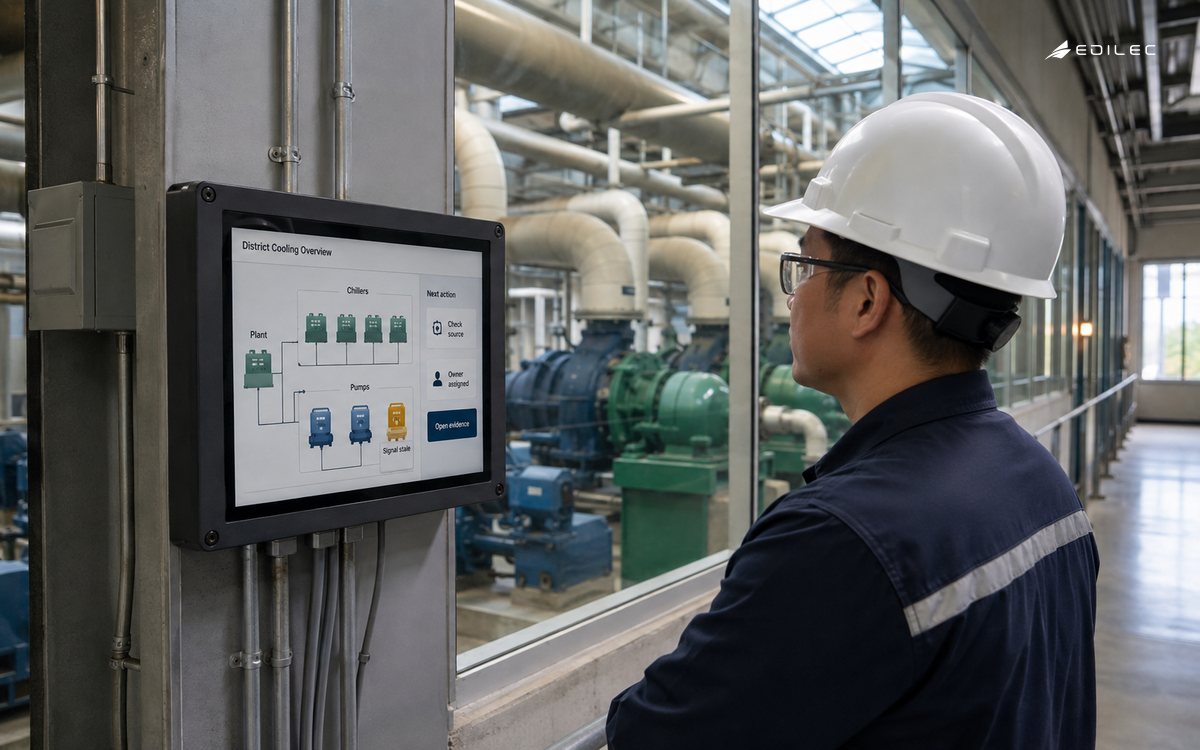
Build a dashboard state model before choosing chart components. Include current, stale, unavailable, maintenance, and exception states; give each a visible treatment and a defined response. Test with a real operator during a noisy period and ask them to identify the source, age, and next action for three signals. The result should be a shared operating surface, not an attractive summary that hides uncertainty.
| Dashboard element | Design decision | Acceptance check |
|---|---|---|
| Signal card | Which value and quality are shown? | Operator can state age and unit |
| Trend | What window and aggregation apply? | Trend explains the decision |
| Alert | Who owns the next action? | Route and acknowledgement are visible |
| Unavailable state | What replaces a missing value? | Stale data is never presented as current |
| Drilldown | Which source evidence is inspectable? | User can trace asset and event |
References for dashboard controls
Use NIST SP 800-82 Rev. 3 to keep the dashboard grounded in OT consequence, NISTIR 8259A for device data and lifecycle assumptions, NIST SP 800-207 for access boundaries, and NIST SP 800-213A for requirement questions. The visual should expose evidence and ownership, not imply more certainty than the source supports.
For related context, compare industrial dashboard engineering notes, sensor data pipeline fixes, and alert routing architecture. Use those perspectives to test the boundary described here while keeping the operating decision and owner in view for industrial dashboards.
Takeaways for decision-ready industrial dashboards
- Industrial dashboards should serve a named operational decision and owner.
- Keep source, time, quality, identity, and authority context near consequential actions during a dashboard decision review.
- Design normal behavior, degraded behavior, and recovery before expanding integrations during a dashboard decision review.
- Treat configuration and contract changes as operating events with evidence during a dashboard decision review.
- Use recurring exceptions to improve the workflow rather than normalize uncertainty during a dashboard decision review.
A useful dashboard review happens on the floor or in the control room, not only in a design meeting. Ask a supervisor to use the screen during a representative task: identify a change, decide whether it matters, find the supporting evidence, and hand the issue to another role. Watch for manual calculations, side conversations, or repeated switches to other tools. Those are clues that a metric lacks context or a workflow boundary is missing. Then repeat with a stale feed or simulated abnormal condition. A dashboard that honestly shows its uncertainty builds better judgment than one that remains polished while its underlying data is incomplete.
Assign an owner to every displayed measure. That owner is responsible for its definition, source behavior, refresh expectation, and retirement when it no longer informs a decision. This prevents obsolete tiles from accumulating until the screen becomes a museum of previous projects.
Industrial dashboard questions
What is the smallest credible first release? One bounded industrial dashboards workflow with a real user, an authoritative record, an exception route, and a recovery exercise. How should uncertainty be handled? Label the state as stale, pending, estimated, or disputed; preserve source evidence; and route consequential ambiguity to the person authorized to resolve it for industrial dashboards. When should the design change? Change it when recurring exceptions, a changed asset class, or a safety and reliability requirement shows that the original rule no longer matches the operation for industrial dashboards.
Conclusion: make dashboard state actionable
Reliable industrial dashboard designs make ordinary work, exceptional work, and recovery understandable to the people responsible for the outcome. Establish the decision, protect the evidence, constrain authority, stage change deliberately, and review actual exceptions with the team that operates the system for industrial dashboards. That is how a connected capability becomes an operational asset instead of another opaque dependency for industrial dashboards.