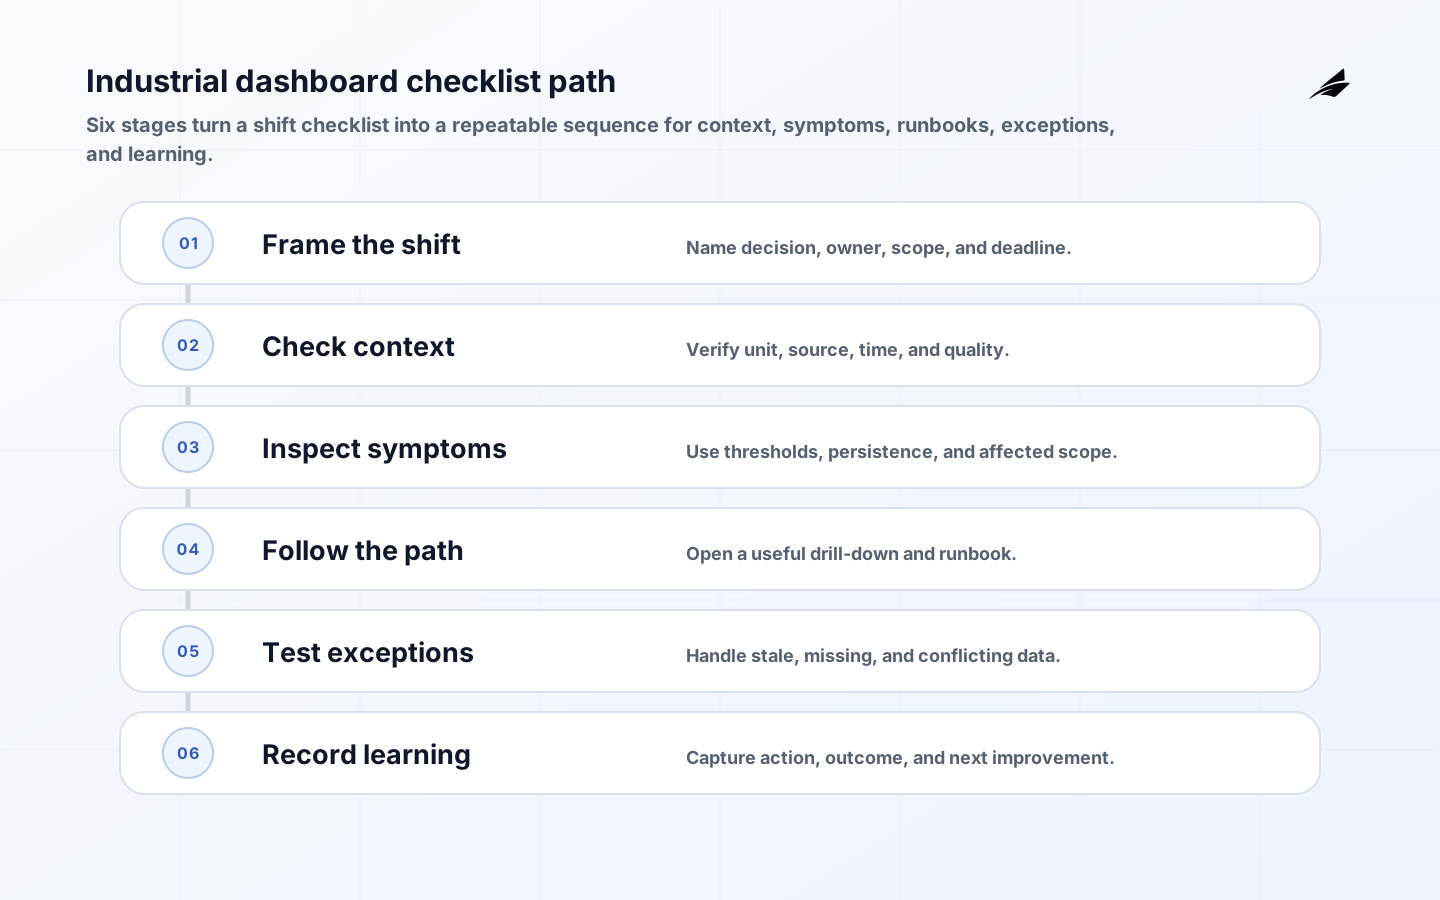
An industrial dashboards checklist should help a person make a reliable decision during a real operating window, not merely confirm that a screen contains charts. Begin with the decision, deadline, source, quality state, and next safe action.
Define The Decision — shift checklist and alert context
Begin industrial dashboards work by writing down the decision in a form an operator can challenge. For this topic, the core asset is a metric register with each display value linked to its source, unit, calculation, owner, update behavior, and the operating decision it is meant to inform. The boundary matters because the screen distinguishes live values, delayed values, estimated values, and manually entered notes so visual confidence never exceeds data confidence. Ask what must still be true when an integration is delayed, a credential fails, a device is replaced, or an engineer is unavailable. A good answer names the system of record, the accountable owner, the required evidence, and the default safe behavior. It does not claim that a network, dashboard, gateway, or service is inherently trustworthy simply because it is familiar.
| Decision area | Question to settle | Evidence before release |
|---|---|---|
| Purpose | Which repeated operation does industrial dashboards improve, and what is the cost of a wrong result? | A named user, decision, and acceptance scenario. |
| Authority | Which role can change policy, data, or configuration, and which role approves an exception? | Role mapping, approval record, and audit event. |
| Time | Which timestamps describe observation, receipt, action, and review? | Examples showing time zone, clock source, and stale-state behavior. |
| Failure | How should the system behave when there is a stale tag presented as live, an aggregate that hides a critical outlier, or a target line that has no owner or review date? | A tested safe alternative, notification owner, and recovery decision. |
Design The Operating Boundary — shift checklist and alert context
The architecture should make normal work and exceptional work equally legible. With industrial dashboards, that means separating the authoritative record from derived views, and separating a request for action from evidence that the action occurred. Avoid an all-or-nothing trust model. Constrain identities and connections to the least access that supports the workflow; keep policy, configuration, and operational records versioned; and retain the context needed to interpret older data. This is how a team can investigate an outcome without reconstructing intent from chat messages or a vendor console after the fact.
- Model the smallest industrial dashboards workflow that changes an important operational decision, including its unhappy path.
- Record the source-of-truth owner, integration maintainer, control rule, and first-response route for each checklist item.
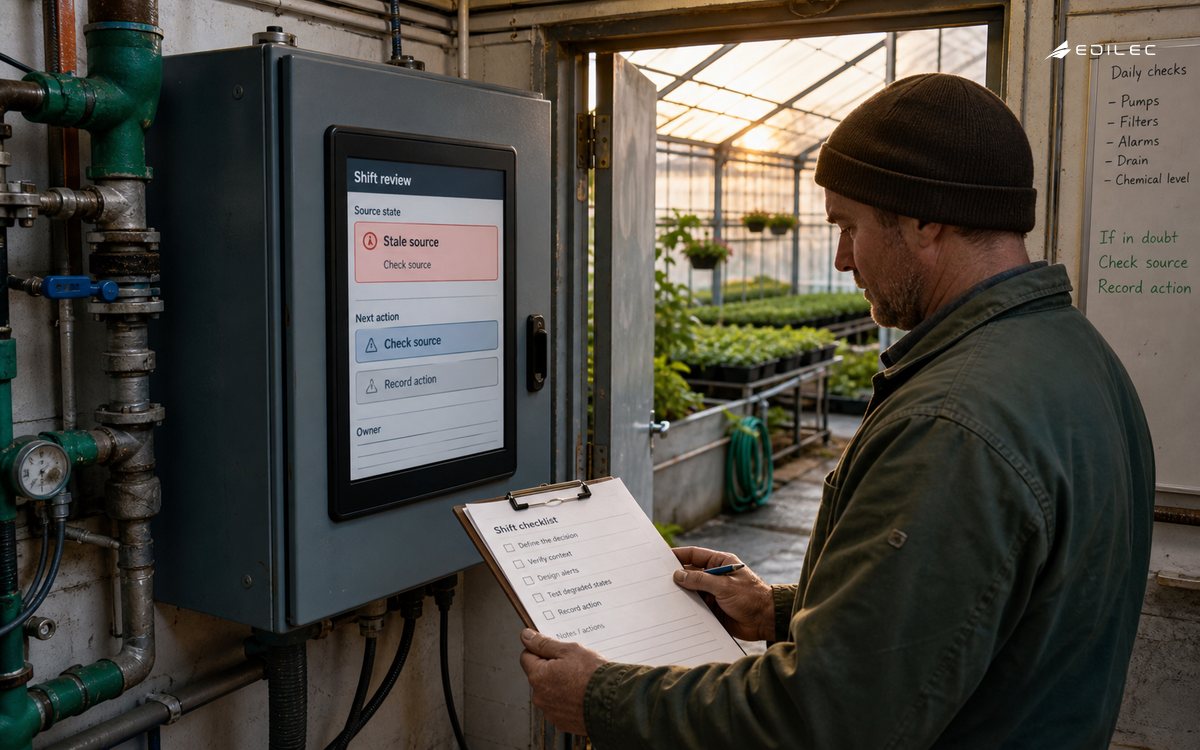
- Put freshness, quality, identity, and authorization beside the signal that drives the shift decision.
- Carry a checklist-run identifier through retries, replacements, corrections, and the resulting action record.
- Bound access, retention, rate, and scope before a temporary dashboard exception becomes an operating habit.
- Test a stale tag presented as live, an aggregate that hides a critical outlier, or a target line that has no owner or review date with the people who would actually diagnose and recover it.
Stage The Rollout — shift checklist and alert context
A controlled rollout is evidence gathering, not merely a smaller deployment. For industrial dashboards, prototype one shift-critical decision with operators, then compare the displayed state against source records before adding a broad executive view. Select a cohort that exposes meaningful variation but has clear operational cover. Decide in advance what result pauses expansion: a security control that cannot be verified, a mismatch between displayed and source state, a performance threshold, or a failed recovery test. Review both successes and near misses with the operating team. The aim is to make adoption repeatable, so the next site, device group, or workflow is added through a known decision rather than improvisation.
| Rollout gate | What to observe | Decision when it fails |
|---|---|---|
| Readiness | Inventory completeness, named owners, and documented preconditions. | Hold the cohort until the missing condition is resolved. |
| Behavior | Normal and adverse industrial dashboards scenarios under representative load and connectivity. | Correct the design or reduce the scope before expanding. |
| Control | Authentication, authorization, logging, and exception approval in the live path. | Remove the uncontrolled path and retest. |
| Recovery | Whether the team can execute retain timestamped source links and a clear stale-data state so an operator can fall back to the controlled system of record when a feed fails. | Keep rollout paused until recovery evidence is repeatable. |
Make Controls Operable — shift checklist and alert context
Controls only help when people can operate them under pressure. Design industrial dashboards so an on-call engineer or supervisor can see what changed, why the system took its current state, and what they are permitted to do next. Temporary access needs expiry and ownership. Changes need a version and a traceable approver. A local fix should leave a visible reason, scope, and removal check instead of silently shifting risk elsewhere. These records give leadership a usable account of governance rather than a collection of screenshots.
For a checklist rollout, compare the same decision before and after the new view is introduced. Count how often the operator needed a second system, asked for undocumented context, or delayed action because the displayed state was ambiguous. Those observations are more useful than adoption totals because they reveal where the checklist fails to carry authority, freshness, or recovery information.
Measure And Review — shift checklist and alert context
Choose measures that reveal whether industrial dashboards are reducing uncertainty in daily work. Track data freshness, acknowledged exceptions, drill-through use, decision latency, and the share of dashboard questions answered without exporting a spreadsheet. Pair each indicator with a review question: does the number describe the controlled system or only the collector? Could a falling count mean that visibility has disappeared? Can the owner explain a material change? Review thresholds after incidents, staffing changes, and architecture changes so the metric remains tied to the work.
| Signal | Why it matters | Review cadence |
|---|---|---|
| Coverage | Shows whether high-consequence assets and service paths are represented, including the difficult cases. | Weekly during rollout; monthly once stable. |
| Freshness | Distinguishes delayed evidence from a current operating state. | Continuously, with a visible stale threshold. |
| Exceptions | Shows where policy or workflow does not fit real work. | Each exception and a monthly trend review. |
| Recovery evidence | Proves the team can restore a known-safe state. | After change and through scheduled exercises. |
Primary references for dashboard checklist design
Use these references to test an industrial dashboard checklist: NIST SP 800-137, OpenTelemetry Metrics Data Model, Prometheus Alerting Best Practices, and RFC 3339: Date and Time on the Internet. Confirm the checklist against site safety and operating requirements.
Use the checklist at the point of action
A checklist for industrial dashboards are valuable only when a person can use it during a real shift. Start with the decision that must be made, the latest useful time, the asset or process scope, and the owner who can act. Confirm that every displayed value has a unit, timestamp, quality state, and source. Check that the dashboard distinguishes a missing reading from a safe reading and a stale reading from a current one. For alerts, identify the symptom, threshold, debounce or persistence rule, affected scope, escalation path, and acknowledgement behavior. NIST SP 800-137’s continuous-monitoring approach is relevant because monitoring should produce evidence for a response, not just a growing collection of counters. A checklist should end with the action the user can take and the record that proves it happened.
For dashboard checklist practice, compare Industrial Dashboards: Engineering Notes, IoT Telemetry Explained: From Device Signal to Decision, Alert Routing: Architecture Guide; together they frame dashboard checklist review, ownership, and recovery without asking the reader to infer the operating boundary.
- Name the decision, owner, scope, and latest useful time.
- Verify units, source, timestamp, and quality state before trusting a value.
- Connect each alert to a symptom, response, and evidence record.
- Exercise the checklist with normal, stale, missing, and conflicting data.
Industrial dashboards checklist for reliable digital operations takeaways for operators
- Industrial dashboards should begin with a named operational decision and accountable owner.
- Keep the authoritative record, derived view, and action request distinguishable.
- Prove the unhappy path and recovery path before widening a rollout.
- Measure uncertainty reduction with freshness, exceptions, coverage, and recovery evidence.
- Treat temporary access, policy changes, and operating thresholds as named checklist work with closure evidence.
Dashboard checklist questions for reliable operations
What belongs on a dashboard checklist? Include the decision, owner, scope, latest useful time, source, unit, timestamp, quality state, alert threshold, escalation path, and evidence of the resulting action. How should a checklist handle uncertainty? Mark stale, missing, estimated, and conflicting values explicitly, then route consequential ambiguity to a named reviewer instead of hiding it. How do teams know the checklist works? Run it during a real shift with normal and degraded data, record every point where a person had to guess, and repair the label, route, threshold, or runbook.
Conclusion: keep dashboard checklist review explainable
Reliable industrial dashboards are less about adopting a fashionable architecture than about keeping promises through normal work, change, and failure. Establish the decision, identify the authoritative evidence, constrain access, stage the rollout, and rehearse recovery. Then use operational signals to revise the design. That sequence creates a system the team can run and explain, even when connectivity, staffing, or upstream services are not behaving politely.