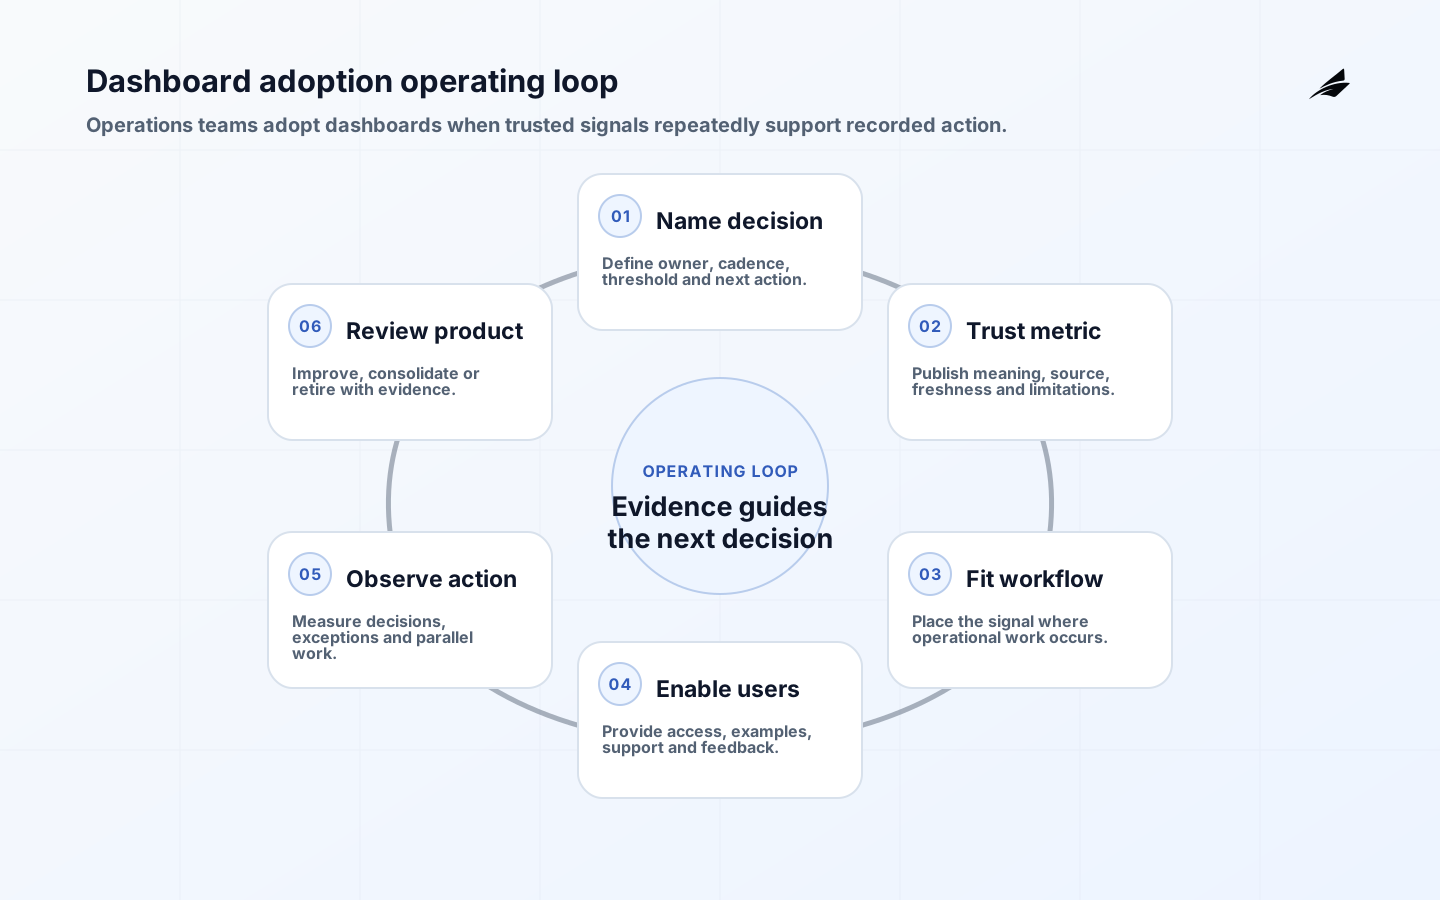
A dashboard earns adoption when it shortens a recurring decision without asking people to reconcile the number first. The cost question is therefore not the licence price or the time spent arranging charts. It is the continuing cost of defining metrics, maintaining source access, answering disputes, and changing a view as the business changes. A CTO should begin with one decision whose current path is slow or inconsistent, such as which accounts need attention this week. That boundary makes dashboard adoption measurable: did the right person open the view, understand the state, and take the intended next action?
Use the W3C PROV overview to frame traceable relationships among reported data, transformations and responsible agents, and use WCAG 2.2 to make keyboard operation, focus, labels and non-color cues part of acceptance. The dbt Semantic Layer illustrates how governed metric definitions can be served consistently across tools. These standards do not create adoption by themselves; they reduce the trust and access friction that otherwise sends operators back to private spreadsheets.
Why dashboard adoption matters
Start by interviewing the decision owner, not a broad audience. Capture the trigger, the decision deadline, the data cut-off, the action that follows, and the consequence of being wrong. A weekly commercial review can tolerate a settled warehouse total; a fraud queue may need a provisional signal with a visible freshness label. Provenance is useful here because it records how an output relates to its inputs and activities, as described by the W3C PROV model. That record turns a disputed number into an investigation rather than a meeting of competing screenshots.
Design the dashboard adoption decision boundary
Design the first dashboard around a reading path. Put the decision state and material exception first, then permit a reader to inspect the contributing population, definitions, and source timing. Give every important metric a grain, filter behavior, owner, and refresh expectation. Do not place unrelated executive curiosities on the same screen simply because the data exists. A narrow dashboard can be retired or repaired; a crowded one becomes an unowned reporting surface that silently accumulates cost.

| Role | Practical responsibility |
|---|---|
| Decision owner | Names the action, deadline, and acceptable uncertainty. |
| Analytics owner | Defines grain, filters, refresh behavior, and reconciliation. |
| Platform owner | Maintains data access, performance, and failure visibility. |
| Reader | Uses the view and reports an ambiguous or missing state. |
Build dashboard adoption in a narrow sequence
Delivery should begin with a thin vertical slice: one source, one role, one decision, and one deliberately awkward case. Reconcile the displayed total to a named source query, test the role that should not see sensitive detail, and ask a realistic reader to explain what they would do next. Instrument usage at the decision level rather than celebrating page views. A dashboard opened before every review but never cited in a decision is not adopted; it is ceremonial.
- Write a one-sentence decision promise before choosing a chart.
- Name a metric owner and a business owner for every headline number.
- Show source timing and exclusions beside material results.
- Test an empty, late, and restricted-data state before launch.
- Review action evidence monthly and retire unused views.
Test the promise before expanding dashboard adoption
Test dashboard behavior in the same conditions in which people will use it. Compare a normal reporting period with a late load, an empty segment, a permission change, and a changed definition. The NIST control catalog is a useful reminder that access, audit, and system integrity are operational concerns, not post-launch decorations. Record the owner who resolves each failure route and the plain-language message a reader receives.
| Signal | What it reveals | Response to prepare |
|---|---|---|
| Reader action | A decision or follow-up is recorded from the view. | Adoption is connected to work, not traffic. |
| Metric dispute | A reader challenges meaning or scope. | Definition, lineage, or labeling needs repair. |
| Freshness breach | The result misses its stated update promise. | Pause or qualify decisions using the view. |
| Export workaround | People rebuild the analysis elsewhere. | The screen lacks a needed path or trusted detail. |
Operate dashboard adoption as a service
Scaling comes from repeatable decisions, not from cloning a layout across departments. Promote common definitions into a governed metric or semantic model only after the initial audience has used them successfully. Review usage alongside freshness, dispute volume, export behavior, and time-to-action. When a view stops supporting a decision, archive it with its definition and final owner rather than leaving a stale route that competes with the current one.
Choose dashboard adoption trade-offs deliberately
Cost planning for dashboard adoption should separate one-time delivery from continuing stewardship. Discovery, semantic definition, source integration, and interface work are visible investments. Less visible are the recurring costs of source changes, access reviews, support questions, and periodic retirement. Estimate those costs against the hours currently spent assembling slides, reconciling spreadsheets, and waiting for an answer. Do not assign a saving merely because a report is automated; count a benefit when a decision is earlier, a recurring manual task disappears, or an avoidable error becomes detectable.
Choose scaling architecture from the decision pattern. A handful of controlled executive views may need a carefully governed semantic model and strong audit trail, while a broad operational audience may need reusable components, role-aware filtering, and a dependable discovery route. Avoid launching a self-service catalog before readers can distinguish certified measures from exploratory work. The scalable unit is not a chart template. It is a documented metric and interaction pattern that can be reused without reintroducing a definition dispute.
Define an adoption measure before launch. Useful measures include the percentage of review decisions supported by the view, the time from exception to assigned follow-up, reader confidence sampled after real use, and the number of manual reconciliations. Pair these with negative signals: repeated exports, conflicting totals, or a sharp drop in use after a source change. A single login metric cannot tell whether the dashboard helped. It can only say that a page was opened.
Review dashboard adoption with operating evidence
Make access design part of the user experience. Readers need enough detail to investigate a variance, but broad row-level access can create unnecessary exposure and anxiety. Define which roles may see identifiers, which should see aggregated results, and what a restricted reader sees instead of a blank or confusing error. Test the experience with a real role. A dashboard that is technically secure but impossible to interpret under normal permissions will invite uncontrolled workarounds.
During quarterly review, compare the dashboard portfolio with the organization's current decision map. Merge duplicate views, retire no-longer-owned metrics, and record why a definition changed. This is a practical form of product management for analytics. It keeps the cost of adoption proportional to the value delivered and prevents every past request from becoming a permanent maintenance obligation.
Related analytics decisions
The dashboard boundary often exposes upstream work. Teams planning metric layers should settle definitions before multiplying visualizations, while analytics documentation keeps ownership and exceptions findable. For a founder's version of the same discipline, see BI dashboards.
Key takeaways for dashboard adoption
- Dashboard adoption should begin with a named decision and an owner who can act.
- State time, scope, source, and failure behavior where readers use the result.
- Test difficult input and recovery paths before adding more consumers or coverage.
- Use operating evidence to decide whether the capability should expand, change, or retire.
Dashboard adoption for operations leaders should be evaluated at the decision point. Microsoft's analytics adoption maturity guidance distinguishes organizational, user and solution adoption, which helps prevent login counts from standing in for value. Pair the BI dashboard first-principles guide with the analytics documentation playbook and inspect whether teams use trusted measures, take a recorded action and retire parallel spreadsheets. Adoption is durable only when governance, enablement and the solution itself mature together. Record the owner and next review date for every operational exception.
Frequently asked questions about dashboard adoption
What counts as dashboard adoption? Adoption is repeated use in a named decision, with a reader who can identify the next action and investigate a number when needed. Should every leadership metric have a dashboard? No. A written operating review may be better when context, narrative, and exceptions matter more than monitoring. How do we estimate cost? Estimate the recurring ownership of definitions, source reliability, permissions, support, and change requests, then compare it with the manual coordination the view removes. When should a dashboard be retired? Retire it when its decision, audience, or trusted source no longer exists; keep a short record so old links do not create a second truth.
Use operating reviews to improve dashboard adoption
Before funding a new dashboard, run a decision walkthrough using the last three real review cycles. For each cycle, ask what question arose, which number was used, how long confirmation took, and whether the same answer could have been reached from a maintained view. This grounds the backlog in observed friction. It may show that the highest-value change is a source reconciliation or a clearer exception state, not another visual treatment.
Make expansion reversible. Release a new audience or drill-down behind a documented access decision, preserve the old view for a short comparison period when definitions change, and give readers a route to report an unexpected result. Reversibility is especially important when dashboard adoption crosses a functional boundary because local knowledge about a metric may not travel with the screen.
At the end of each operating cycle, ask whether the dashboard changed the quality or speed of a decision. Record one supported decision, one unresolved ambiguity, and one change to the definition, data path, or interface. This keeps dashboard adoption tied to useful work and gives the next investment discussion evidence stronger than enthusiasm.
Conclusion: make dashboard adoption dependable
Dashboard adoption becomes durable when the organization treats a dashboard as a maintained decision product. Begin with a specific action, expose meaning and timing, test the awkward states, and use real reader behavior to decide whether the view deserves expansion.