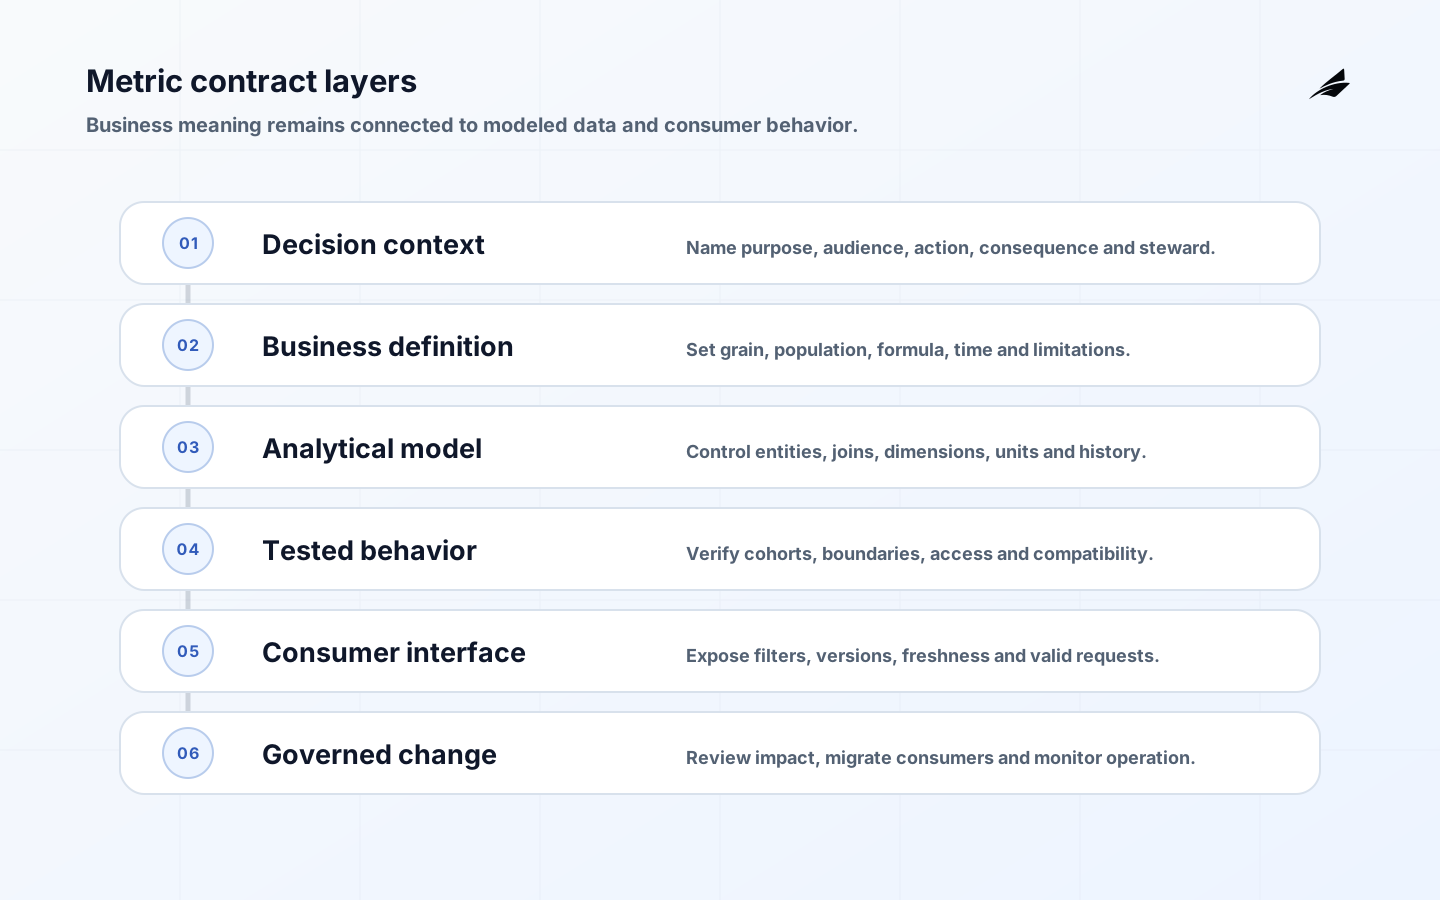
Metric layers for data analytics provide a maintained interface for business measures such as active customers, recurring revenue, fulfillment rate or conversion. They define how a measure is calculated, which entities and dimensions it can use, how time and filters behave, and who owns change. Dashboards, notebooks and applications can then request the same meaning without copying calculation logic. A metric layer is valuable when it reduces consequential disagreement while preserving the context needed to explain a result.
This guide focuses on architecture, definition, testing, delivery and governance. It complements Edilec's semantic layer planning guide, warehouse modeling guide and BI dashboard guide for founders. A warehouse model organizes reliable facts and dimensions; a metric layer adds decision-level measure behavior and a consumer contract.
Decide when a metric layer is justified
Start with recurring decisions and visible inconsistency. Inventory the measures used in executive, product, finance and operational work. Compare names, formulas, populations, joins, time zones and filters. A shared layer is justified when a metric is reused across teams or applications, disagreement changes decisions, and a named owner can resolve meaning. Exploratory calculations can remain local and clearly labeled. Centralizing every temporary measure creates review congestion without improving trust.
Distinguish a metric layer from a BI model and catalog. Looker's LookML concepts describe views, dimensions, measures and explores used to generate queries. Power BI semantic models can import data or query sources and support model behavior and security. A cross-tool metric layer may sit above warehouse models and expose measures through APIs or integrations; a tool-native semantic model may be enough when one governed BI surface is the true boundary.
| Need | Best first response | Metric layer signal |
|---|---|---|
| One report is wrong | Repair its query and model | Not enough evidence for a platform |
| Same KPI differs across tools | Compare definitions and consumers | Strong candidate for shared metric |
| Analysts need discovery | Improve catalog and documentation | Metric layer helps only for measures |
| Applications need governed numbers | Define an API-level contract | Metric service may be appropriate |
| Definitions change frequently | Clarify ownership and version policy | Code alone will not resolve meaning |
Write the metric contract before code
For each metric, state decision purpose, owner, entity grain, counted or aggregated value, eligible population, formula, time basis, timezone, attribution window, required exclusions, allowed dimensions, null treatment, currency or unit, freshness and known limitations. Define whether a ratio is computed from aggregate numerator and denominator or averaged from row-level ratios. Record additive behavior across time and dimensions. These details prevent a plausible query from changing the business question.

Give measures, entities and dimensions durable business names rather than warehouse-table names. Include status such as experimental, certified, deprecated and retired. Certification should mean that meaning, implementation, tests, ownership and operating expectations were reviewed; it should not mean universal suitability. Publish examples and counterexamples. A gross-revenue metric can be correct and still inappropriate for cash collection or tax reporting. Consumers need the limitation at discovery time.
Model entities, joins and time explicitly
Build on tested facts and dimensions with grain visible. Define entity keys and join cardinality, and prevent paths that multiply measures. State which dimensions are valid for each measure. A customer dimension at current state may be wrong for a historical revenue metric if segment changes over time. Decide whether dimensions are evaluated at event time, reporting time or another effective date. Reject unsupported combinations instead of returning a convincing but undefined result.
Time requires a contract: event time, processing time, accounting period, timezone, week start, fiscal calendar and completeness. Define windows for active users, retention and attribution. Make late data and corrections visible. Currency metrics need source amount, currency, conversion source, rate date and rounding behavior. Semi-additive measures such as account balance may aggregate across accounts but not across dates. Encode that behavior so consumers cannot accidentally sum a snapshot over time.
Choose a consumer interface and execution model
The dbt Semantic Layer is one implementation that centralizes metric definitions and generates queries through supported integrations. Other choices include BI-native models, query services and custom APIs. Evaluate supported warehouses, BI tools, notebooks, applications, dimensions, access controls, caching, lineage, versioning and operational ownership. Prove one metric through two unlike consumers before selecting a broad platform. The interface should reduce local logic, not merely move it into another inaccessible place.
Define request behavior for metric name and version, dimensions, filters, time grain, timezone, format and unsupported combinations. Return definition version, data freshness and relevant warnings with the result where the interface allows it. Establish latency and availability expectations. A slow service encourages extracts and copied SQL, while opaque caching can make two valid requests differ. Choose pre-aggregation and caching from measured query shapes and explain freshness tradeoffs.
Test numerical meaning and interface behavior
Test source uniqueness, accepted values, relationships and freshness, then add metric-specific assertions. Use small fixtures for boundary behavior and agreed historical periods for reconciliation. Cover empty populations, nulls, duplicate joins, late events, timezone boundaries, fiscal transitions, dimension filters, access-conditioned results and large cardinality. Compare outputs across supported consumers. A successful SQL compile does not prove that the result matches the business definition.
For a changed metric, run old and new definitions over representative history and segment the difference. Ask the owner whether it is a bug fix, policy change or new metric. Test compatibility of names, defaults, filters and response schemas. Performance tests should use common query shapes and worst credible dimension cardinality. Security tests must verify row and column restrictions through every interface and cache. Preserve test data and expected outputs with the definition version.
| Test class | Example assertion | Failure meaning |
|---|---|---|
| Definition | Known cohort matches approved result | Formula or source meaning diverged |
| Join | Adding a dimension preserves valid totals | Cardinality or grain is unsafe |
| Time | Boundary events enter the agreed period | Timezone or calendar behavior changed |
| Compatibility | Existing request returns supported behavior | Consumer migration is required |
| Access | Restricted entity never appears in result or cache | Security boundary failed |
| Performance | Common request meets latency target | Consumers may bypass the layer |
Govern definitions without blocking exploration
Use version-controlled definitions, review and automated tests, but keep business authority explicit. A metric steward decides meaning; analytics engineering owns implementation; platform owners operate interfaces; consumer owners validate use. Set review depth by consequence. A new experimental product measure can move quickly with a clear label, while a revenue definition needs finance approval and controlled effective dates. Keep one decision record rather than conflicting documents and code comments.
Version a material meaning change and provide a migration window. Silent replacement can create artificial trend breaks; indefinite parallel versions create clutter. Publish changed population, expected impact, effective date, historical restatement and consumer action. Discover usage before deprecation through query and lineage evidence. Microsoft documents shared semantic-model discovery and certification, illustrating how governed models become reusable only when consumers can find and trust them.
Make provenance and operation visible
A result should be traceable to definition version, contributing models or sources, evaluation time, filters and access context. The W3C PROV-O recommendation provides a general vocabulary around entities, activities and agents; teams can apply the underlying provenance concepts without adopting RDF. Preserve enough lineage to investigate a number while keeping implementation details from overwhelming ordinary users. Separate technical lineage from the concise business explanation.
Operate the layer as an internal product. Monitor request success, latency, warehouse cost, cache behavior, freshness, cross-consumer variance, uncertified reuse, deprecated use and support demand. Assign incident response and communicate source delays. Review product changes that alter familiar measures: pricing, consent, feature flags and workflow steps can change meaning even when SQL still runs. Use demand evidence to prioritize new metrics and dimensions rather than accepting the loudest request.
Migrate consumers in deliberate waves
Begin with one consequential inconsistent metric and two consumers. Publish side-by-side results, explain differences and collect unsupported query patterns. Improve discovery, examples and latency before expanding. Inventory local calculations, then classify them as replace, remain local or redesign. Give owners a migration date and observable adoption. Do not declare success because a central definition exists; success means material decisions use it and discrepancies can be resolved quickly.
Control platform cost and organizational load
Measure warehouse execution, cache storage, API capacity, implementation effort, steward review and consumer support. A centralized layer can reduce duplicated work while creating a new high-availability dependency. Set service tiers for executive reporting, interactive analysis and embedded application use rather than promising one latency and freshness profile for all consumers. Review expensive query shapes with owners and improve modeling or approved aggregates before imposing arbitrary restrictions that drive users back to local extracts.
Key takeaways
- Create shared metrics for recurring consequential decisions, not every exploratory calculation.
- Define grain, population, time, dimensions, units, ownership and limitations before implementation.
- Reject invalid dimension and filter combinations instead of returning plausible results.
- Test meaning across known cohorts, edge cases, consumers, security boundaries and performance.
- Version material changes and operate the interface with lineage, freshness and adoption evidence.
Frequently asked questions
Is a metric layer the same as a semantic layer? A metric layer is often part of a broader semantic layer, focused on reusable measure behavior. Does it replace warehouse modeling? No; it depends on reliable facts, dimensions and keys. Should all metrics be certified? No; experimental measures should remain discoverable but clearly distinguished. Can applications use the layer? Yes, when the interface, latency, versioning and availability meet product needs. Who approves a definition change? The named business steward, with implementation and consumer owners contributing evidence and impact.
Conclusion
Metric layers for data analytics work when they preserve the meaning around a number while making the correct calculation easier to reuse. Start from a real decision conflict, write a complete contract, prove behavior through unlike consumers and govern change with evidence. The result is not one universal truth for every question, but a dependable set of shared measures whose scope and limitations are understood.