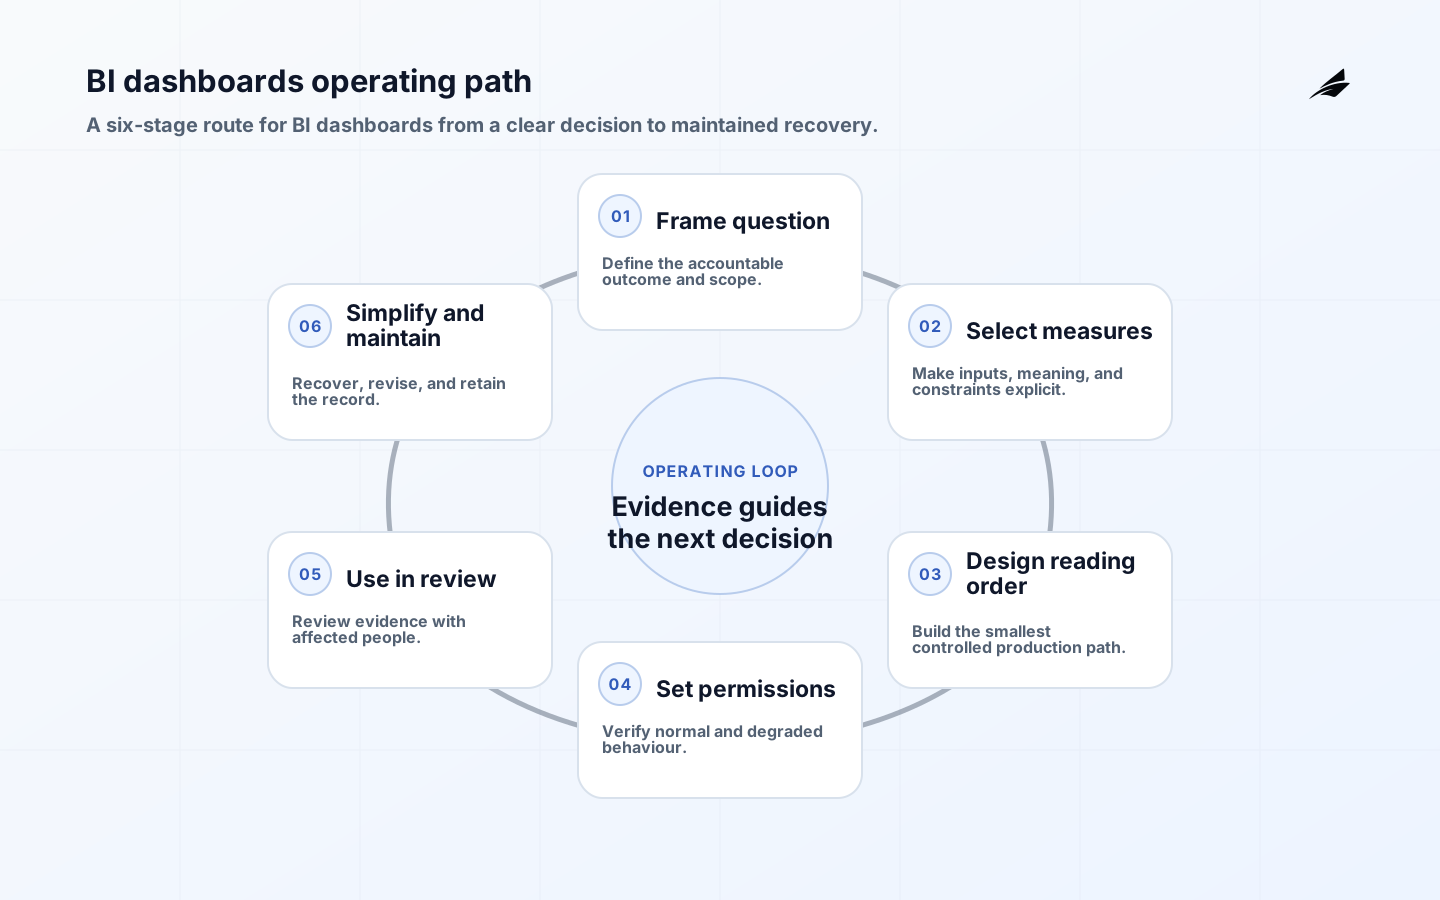
Plain-language BI dashboard guidance starts with the question a reader needs to answer, then makes the audience, comparison baseline, action threshold, access rule, and data status visible. Tableau data visualization and W3C WCAG provide useful primary reference points. Related implementation context is available in BI Dashboards Explained from First Principles, Executive Dashboards: Operations Playbook, and How Engineering Teams Should Think About BI Dashboards. The accountable owner should confirm which decision the page supports and who may act on it.
Put the dashboard question in plain language
Start with an operational, tactical, or strategic question. Name the person who acts, the time available to act, and the evidence that makes the decision defensible, in the plain-language dashboard use context. This prevents BI dashboards from becoming a generic platform project. A useful boundary is specific enough that a new operator can identify the protected outcome, the accountable owner, and the consequence of a late, wrong, or missing result, in the plain-language dashboard use context. Put that boundary beside the dashboard’s decision statement so a reviewer can challenge it without searching through implementation notes.

| Design concern | Question to settle | Evidence to keep |
|---|---|---|
| Decision boundary | What use of BI dashboards must improve? | Named owner and workflow |
| Definition | What entity, measure, or event is represented? | Written grain, scope, and examples |
| Service expectation | How fresh, complete, or controlled must it be? | Threshold and visible status |
| Change rule | Who approves a revision? | Review record and effective date |
Explain grain, cutoff, and data status on the page
Define audience, comparison baseline, action threshold, access rule, and data status before extending scope. State the grain, time basis, permitted audience, expected freshness, and behaviour when an input is missing or late, in the plain-language dashboard use context. This work is not administrative polish. It determines whether two readers can reach the same conclusion from the same output and whether a response team can distinguish an ordinary delay from a material failure. Treat each item as an acceptance condition for the next dashboard release.
Write the normal route and degraded route together. Identify the source of truth, the component that enforces the important rule, the moment a result becomes visible, and the authority allowed to mark it unsafe, in the plain-language dashboard use context. The exercise exposes manual steps, timing assumptions, and dependencies that are invisible in a happy-path diagram, in the plain-language dashboard use context. Capture the degraded route as a reader-facing status and a responder-facing runbook, not as an assumption held by the builder.
Assign ownership for interpretation and action
Ownership for BI dashboards is not a title on a slide. A business owner decides whether the result remains useful; a technical owner maintains the implementation, access path, and evidence, in the plain-language dashboard use context. Changes need a proportionate review route, including an urgent path that records scope, reason, expiry, and follow-up, in the plain-language dashboard use context. Access and distribution deserve the same care because a correct result can still cause harm when shown to the wrong audience, in the plain-language dashboard use context. Make those responsibilities visible in the release record and the support route.
- Name the business decision owner and technical operator.
- Record definition, boundary, and acceptable failure state.
- Restrict change authority while keeping feedback available.
- Set approval routes for normal, urgent, and breaking changes.
- Keep access and distribution decisions visible beside delivery.
- Schedule a review that can retire an assumption.
Test comprehension with normal and partial data
Measure decision traces, review use, drill paths, accessibility findings, and stale subscriptions. A signal is useful only when someone can interpret it and take a defined action specifically for plain-language dashboard use. W3C PROV overview and dbt documentation help make validation, dependencies, and change history visible. Validate the actual data, permissions, scale, and business rules in the environment where people rely on the output; an attractive design or passing isolated test does not prove that a decision is safe, in the plain-language dashboard use context. Review the signals with the owner who can change the workflow, not just the team that built the page.
| Signal or failure | What it reveals | Operating response |
|---|---|---|
| Health signal | decision traces, review use, drill paths, accessibility findings, and stale subscriptions | Review at the named operating cadence |
| Known risk | visual overload, unexplained targets, colour-only encoding, or access mismatch | Decide whether to stop, warn, repair, or rollback |
| Evidence path | Can a reader trace the result to its source? | Link lineage, tests, and change notes |
| Recovery check | What evidence shows that BI dashboards has returned to a safe operating state? | Practice and record the response |
Use rollout controls that protect reader trust
Release the smallest BI dashboards path that can produce real evidence. Preserve a baseline, test one normal route and one plausible failure with the people who will respond, then review results before widening use or automation, in the plain-language dashboard use context. A pilot succeeds when it reveals assumptions early and leaves a clearer operating record, not merely when it avoids an error message, in the plain-language dashboard use context. The release decision should state what the pilot proved, what remains uncertain, and which owner will check the next cycle.
- 1. Frame question: name the recurring decision, accountable reader, and deadline.
- 2. Select measures: define grain, comparison, cutoff, and acceptable uncertainty.
- 3. Design reading order: put the decision signal first and the diagnostic path second.
- 4. Set permissions: expose only the detail each role needs to act safely.
- 5. Use in review: record the action, challenge, exception, and owner follow-up.
- 6. Simplify and maintain: remove misleading views and revise the definition with evidence.
Scenario: a late feed changes a leadership view
The most expensive BI dashboards failures are plausible outputs that should not have been trusted. Watch for visual overload, unexplained targets, colour-only encoding, or access mismatch. Do not solve these conditions by adding more reports, documents, or approvals specifically for plain-language dashboard use. Make the assumption, owner, verification, and repair route concrete so a reviewer can see when the declared promise has stopped being true, in the plain-language dashboard use context. For each failure, record the reader action that must pause and the evidence that permits resumption.
Recovery planning belongs in the design. Keep a current runbook, identify the authority to pause or publish a warning, and retain identifiers needed to trace an affected result, in the plain-language dashboard use context. Exercise a bounded response scenario. This turns a vague resilience claim into evidence that people can restore a safe state without widening harm or hiding uncertainty from users, in the plain-language dashboard use context. The rehearsal should end with a reader-facing correction and a dated follow-up, not just a green job status.
For BI dashboards, make the default state earn its place. It should show the comparison and time period most likely to guide the named audience, while preserving a clear drill path for investigation. Test the page at the screen size and assistive-technology settings used by its readers. If a user cannot tell what is current, what is selected, or what action follows a threshold, the dashboard has not yet delivered its decision interface regardless of how many visualisations it contains.
A practical BI dashboards review should finish with an explicit decision log. Record what was observed, which assumption was confirmed or challenged, the owner of the next action, and the date the action will be checked, in the plain-language dashboard use context. Link that record to the relevant definition, test result, incident, or change request specifically for plain-language dashboard use. This modest discipline makes later review faster because it preserves why a choice was made, not only the configuration that happened to survive, in the plain-language dashboard use context. It also gives new contributors a concrete way to question a result without rebuilding the entire history from scattered conversations, in the plain-language dashboard use context.
Key Takeaways
- Anchor work in a named decision and accountable owner.
- Make definitions, boundaries, and access expectations visible.
- Keep operational evidence close to the change that produced it.
- Test degraded conditions, not only the successful path.
- Retire obsolete or competing paths before ambiguity accumulates.
Reference checkpoints for plain-language dashboard use: Use Tableau data visualization to check plain-language dashboard use at definition time. Use W3C WCAG to check plain-language dashboard use at release time. Use W3C PROV overview to check plain-language dashboard use at review time. Use dbt documentation to check plain-language dashboard use at exception time.
Frequently Asked Questions
Use these questions to check whether a reader can understand a dashboard and act safely when its data is incomplete.
Conclusion
Reliable BI dashboards are neither a one-time configuration nor a document completed in isolation. It is an owned decision with clear boundaries, proportionate controls, observable outcomes, and a practiced recovery route, in the plain-language dashboard use context. Begin with the narrowest valuable use case, retain the evidence it produces, and expand only when responsible people can operate the result confidently, in the plain-language dashboard use context. Revisit the promise when the audience, definition, or decision cadence changes.
For plain-language BI dashboards, reliability is demonstrated when a reader can state the question, measure, cutoff, status, and next action without a private translation layer. The owning team should revisit that promise whenever the audience, definition, or decision cadence changes.
Ask a leadership reader to use a dashboard while its event feed is late. The page should identify the affected cutoff, qualify the measure, show the safe decisions, and route the reader to an owner. If the reader copies the stale value before seeing that status, the language and layout still need work.
For a BI dashboard to earn trust, its owner should define the decision it supports, the population represented, the refresh boundary, and the action taken when those conditions fail. Test the dashboard with a normal period and an exception period: a late source, an incomplete segment, a changed definition, or an access denial. Record the expected result, the observed result, and the person authorized to qualify or pause publication. This makes dashboard documentation operational rather than decorative and gives reviewers a concrete basis for deciding whether the next change is safe.