Metric layers for data analytics centralize the executable meaning of measures such as revenue, active customers, conversion and on-time delivery so dashboards, notebooks, applications and AI systems do not rebuild the logic independently. A metric layer is not merely a glossary or a folder of SQL. It connects measures to valid dimensions, entities, time semantics, filters, joins, access rules and query behavior. Done well, it makes disagreements explainable. Done poorly, it creates an opaque new bottleneck that returns consistent but incorrect numbers.
This guide complements Edilec's metric layer implementation checklist, semantic layers for engineering teams and production metric layers guide. Start with a few high-value decisions and conflicting metrics. Tool selection should follow requirements for expressiveness, compatibility, access, latency, cost and ownership, not lead the design.
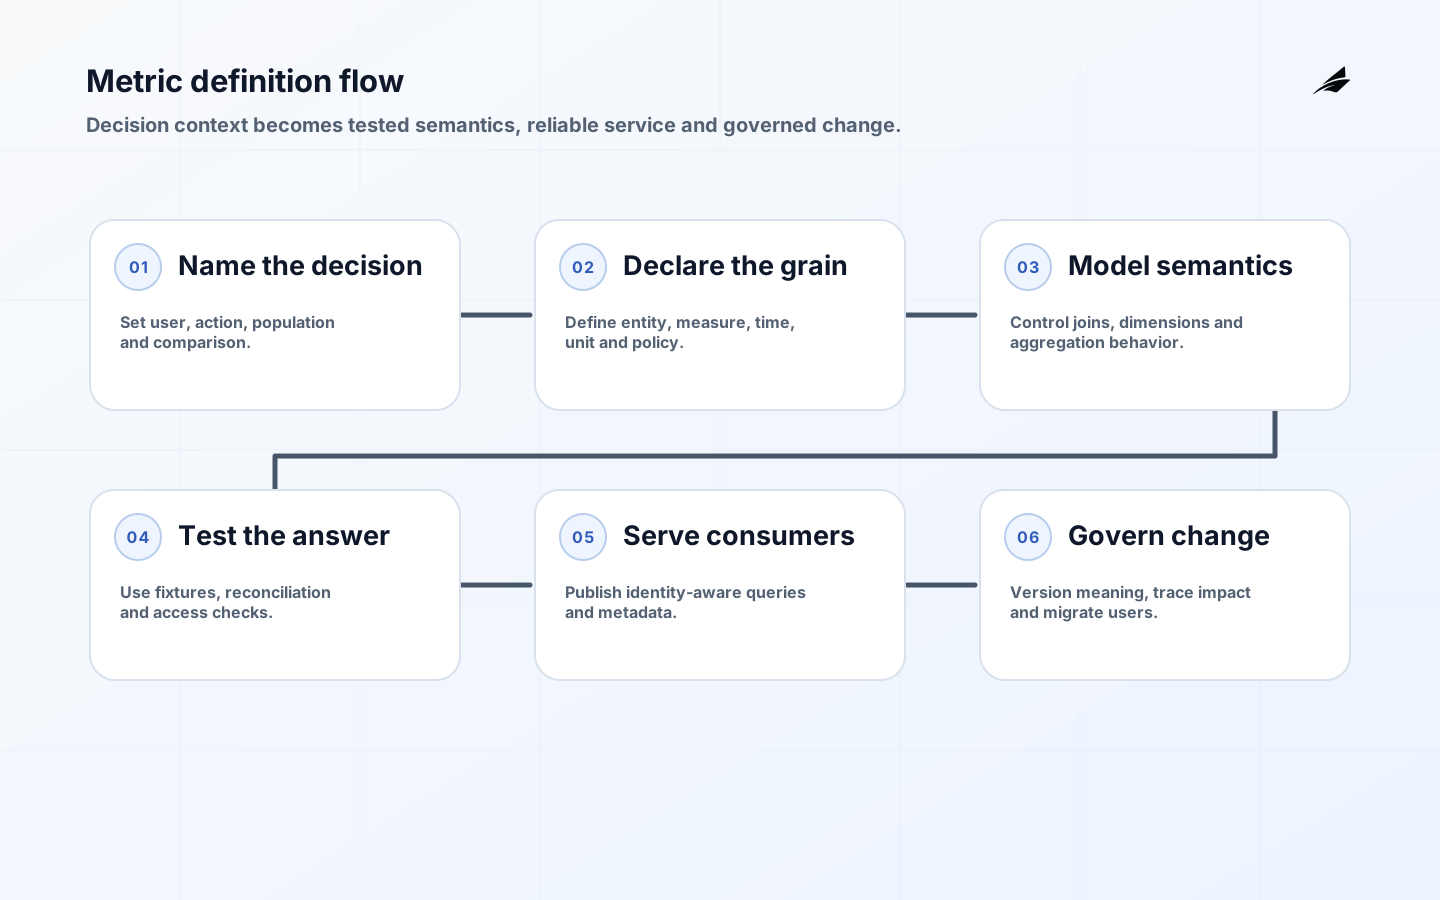
1. Start with a decision and declare the grain
For each candidate metric, name the decision, user, population, comparison and action. Define what one underlying row or event represents before writing a formula. Orders, order lines, invoices and payments have different grains; joining them carelessly can multiply amounts. State the entity key, event time, effective time, timezone, late-data policy and correction behavior. Identify the authoritative source and reconciliation control. A metric without a declared grain and time basis is not ready for reuse.
Use a metric contract containing business name, technical identifier, plain-language purpose, owner, formula, base measure, dimensions, default filters, exclusions, currency or unit, aggregation, valid date range, freshness and examples. Include known limitations and a deprecation state. The W3C Data on the Web Best Practices emphasizes metadata, provenance, versioning and quality; those principles remain useful even when the metric is served internally rather than published on the web.
| Contract field | Question | Example |
|---|---|---|
| Grain | What does one fact represent? | One accepted order line |
| Measure | What quantity is aggregated? | Net line amount in transaction currency |
| Time | Which event and timezone apply? | Acceptance timestamp in customer timezone |
| Dimensions | Which groupings are valid? | Product, region and customer segment |
| Policy | What is excluded or restated? | Test accounts excluded; refunds on event date |
| Owner | Who approves meaning and change? | Revenue operations data owner |
2. Build an explicit semantic model
Model entities, measures, dimensions and relationships as a graph. Classify join cardinality and prevent paths that fan out or create ambiguous results. Resolve slowly changing attributes according to the decision: current customer segment and segment at transaction time answer different questions. Define additive, semi-additive and non-additive behavior. Ratios should aggregate numerator and denominator before division rather than average precomputed percentages. Distinct counts need careful behavior across time and dimensions.

Current tools encode these ideas differently. MetricFlow compiles semantic definitions into query plans and SQL, while Cube documentation describes a semantic layer serving governed models to BI, embedded analytics and agents. Evaluate capabilities with representative hard cases: multi-hop joins, cumulative metrics, conversion windows, cohort logic, multiple calendars, access filters and mixed currencies. Portability claims matter less than whether definitions and tests remain understandable outside the product UI.
3. Test meaning, SQL and reconciliation
Test source assumptions, entity uniqueness, relationships, accepted values and freshness before metric logic. Add small fixtures with known answers for normal and edge cases: duplicate events, refunds, late arrival, missing dimensions, slowly changing attributes and empty denominators. Compile representative queries and inspect joins. Compare metric results with an independent control total or current authoritative report during migration. Differences need categorized explanations; forcing equality by adding undocumented filters simply moves confusion into the layer.
Build compatibility tests for consumer queries and access context. A definition change can preserve the metric name while altering results, dimensions or latency. Capture expected query shape, values and metadata for critical consumers. Test row and column security with multiple roles and tenants, including attempts to infer suppressed groups. Performance tests should use realistic combinations and concurrency. Cache correctness, invalidation and freshness are part of semantic correctness when users make time-sensitive decisions.
4. Serve metrics across analytics tools
Choose interfaces based on consumer behavior: SQL, APIs, BI integrations, notebooks, materialized exports or embedded analytics. The dbt Semantic Layer documentation is one current example of centrally defined metrics queried by downstream tools. Make user identity and access context flow through the interface. Return metric metadata, definition version and freshness with results where possible. Do not let exported tables become undocumented forks; publish ownership and refresh policy.
Set service objectives for availability, query latency, freshness and correctness. Protect the warehouse with query limits, caching, pre-aggregation and workload management. Observe demand by metric and interface without exposing sensitive values or creating unbounded labels. Provide useful errors for invalid dimensions, unsupported time grains and permission denial. A metric layer should stop impossible questions instead of generating plausible SQL. Maintain a break-glass path for incident investigation, not a routine bypass for impatient consumers.
| Operating signal | Interpretation | Action |
|---|---|---|
| Certified metric adoption | Whether governed definitions are used | Prioritize migration of high-risk duplicates |
| Reconciliation difference | Potential source or semantic defect | Trace by grain, filter, time and join |
| Query failure by reason | Model gaps or consumer misuse | Improve definition, interface or guidance |
| Freshness attainment | Whether decisions use timely data | Repair upstream or revise commitment |
| Cost and latency by metric | Expensive logic or access pattern | Optimize plan, cache or materialization |
| Definition change impact | Consumers exposed to changed meaning | Version, communicate and migrate |
5. Govern definitions without blocking use
Assign a business owner for meaning and a technical owner for implementation. Create a lightweight proposal containing decision impact, formula, examples, source readiness, dimensions, access and migration. Let domain teams contribute through version control and review while a small governance group resolves cross-domain conflicts. Certification should indicate evidence and scope, not political importance. Allow experimental metrics in a clearly separate namespace with expiry so exploration remains possible without presenting drafts as enterprise truth.
Use semantic versioning principles based on consumer impact. Additive metadata may be compatible; changed formula, grain, default filter or time basis usually requires a new version or migration window. Publish change notes and affected consumers. OpenLineage documentation provides an open approach to lineage metadata; whichever lineage system is used, connect source, transformation, semantic definition and consuming asset. Automated lineage helps discovery, but owners must still explain business consequence.
6. Roll out around real decisions
Select three to five metrics with material disagreement or duplicated logic and active owners. Implement complete contracts, tests, one serving interface and migration for named consumers. Run old and new results in parallel, explain differences and obtain owner acceptance. Measure reduced duplicate logic, investigation time and adoption, not just number of definitions. Expand by coherent domain so shared entities and dimensions mature together. Avoid loading hundreds of glossary entries before the query and operating paths are proven.
For AI analytics, expose only certified or clearly labeled metrics, permitted dimensions and definition metadata. Require the agent to identify the metric and filters used rather than inventing business logic against raw tables. Evaluate questions with known answers and adversarial requests for unauthorized breakdowns. A semantic layer can constrain calculation and access, but it cannot correct poor source data or ambiguous organizational policy. Keep human ownership and recourse visible.
Watch for common anti-patterns. A giant universal semantic model creates ambiguous joins and slow ownership. Copying dashboard calculations into central definitions preserves inconsistency under a new name. Certification without reconciliation creates false authority. Allowing every consumer to override filters or SQL defeats governance. Requiring the central team to implement every local measure creates a queue that drives users back to shadow logic. Use domain boundaries, contribution workflows and explicit experimental space to keep control proportionate.
Document denominator and population changes as carefully as formulas. Many metric disputes arise because one report includes pending customers, test transactions or partial periods and another does not. Provide query explainability that shows selected metric version, time range, filters, dimensions and source freshness. For a material board, regulatory or customer-facing number, retain the rendered result and definition version used at that time. Reproducibility matters even after source data is corrected.
Build a support model. Analysts need a route to report an unexpected value with query context, while owners need triage for source defects, semantic defects, access issues and legitimate misunderstanding. Publish service hours and severity based on decision impact. Review recurring questions as model-design feedback. A metric layer earns adoption when users can challenge a number and receive an evidence-based explanation, not when governance discourages questions.
Treat privacy and confidentiality as semantic concerns. A harmless metric can reveal a sensitive value when filtered to a very small group or joined with another dimension. Define minimum aggregation, suppression, purpose and export rules where required. Test them through every interface, including AI and embedded analytics. Security applied only in the dashboard is bypassed when another consumer reaches the metric service directly.
Key takeaways
- Tie every metric to a decision, grain, time basis, owner and reconciliation control.
- Model join cardinality and aggregation behavior explicitly.
- Test known answers, edge cases, access and downstream compatibility.
- Operate the layer with freshness, latency, correctness, cost and adoption objectives.
- Version material semantic changes and migrate consumers deliberately.
Frequently asked questions
Is a metric layer the same as a semantic layer? A metric layer often focuses on governed measures; semantic layers may also model entities, dimensions, joins and access. Does it replace the warehouse or dbt? No; it sits above prepared data and compiles or serves semantic queries. Should every metric be centralized? Prioritize reused, consequential definitions; local exploration can remain local. How are conflicting definitions handled? Clarify different decisions and scopes before forcing one formula. Can AI query the layer? Yes, with governed access, known-answer evaluation and transparent metric selection.
Conclusion
A useful metric layer is an executable contract between business meaning and analytical computation. Declared grain, explicit joins, testable formulas, reliable serving and disciplined change make numbers comparable without concealing nuance. Begin with contested decisions, prove the full operating path and expand only as ownership and evidence remain strong.