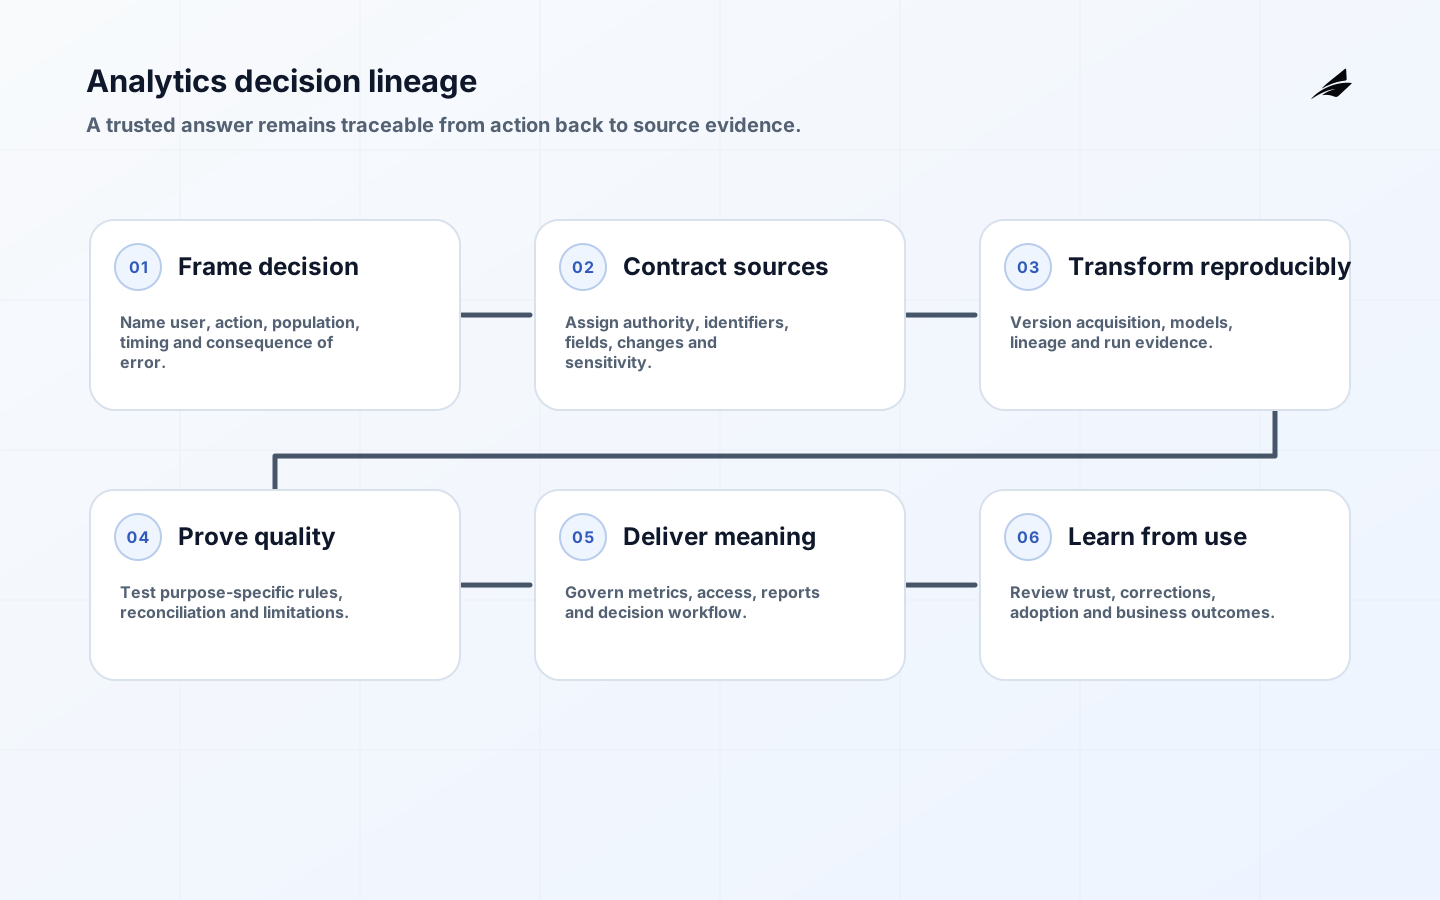
Data and analytics services should help a defined group make a better decision with evidence they understand and trust. Warehouses, pipelines, dashboards and models are means to that outcome. This data and analytics services implementation checklist connects business questions to owned sources, tested transformations, governed measures, secure delivery and a feedback loop that shows whether the insight changed work.
Use it with the data and analytics scope guide, data and analytics FAQ and data and AI services checklist. Begin with one valuable decision domain rather than importing every available table and hoping useful analysis appears later.
1. Define decisions, users and acceptance measures
Name the decision, decision owner, frequency, available actions and consequence of error. A sales forecast used to set staffing requires different timeliness and uncertainty communication from a daily list of unshipped orders. Interview decision-makers and people who create the source data. Record current evidence, workarounds and disputes. Baseline time to answer, manual effort, correction rate and decision delay.
Write acceptance criteria for use, not only data loading. State which population is included, when data is considered complete, how restatements appear, what comparisons are valid and which users can act. Define a small set of outcome measures such as reduced reconciliation time, faster exception resolution or fewer conflicting reports. Page views alone do not establish that analytics improves decisions.
| Definition field | Example | Why it matters |
|---|---|---|
| Decision | Which orders need intervention before the promised date? | Constrains data and freshness to an actionable use |
| Population | Open customer orders excluding approved holds | Prevents hidden scope disagreement |
| Measure | At-risk order value in reporting currency | Makes aggregation and conversion rules explicit |
| Freshness | Source events reflected within 30 minutes | Sets pipeline and operating expectations |
| Action owner | Regional fulfillment manager | Links insight to accountable work |
| Limitation | Carrier scans may lag during outages | Communicates confidence and degraded behavior |
2. Assign source authority and data contracts
Inventory source systems, owners, capture processes, identifiers, refresh behavior, retention and known defects. Distinguish the authoritative record from a convenient extract. A CRM may own opportunity stage while an ERP owns invoiced revenue; merging them requires explicit business keys and time semantics. Assign a data owner who decides meaning and access, and a steward who coordinates quality and documentation.
Create source contracts for fields the service depends on: definition, type, allowed values, null meaning, effective time, update pattern, sensitivity and change notice. Contracts do not prevent change; they make impact visible. Agree how deleted or corrected records are represented and how consumers replay missed data. Keep raw acquisition immutable where lawful and useful so transformations can be reproduced.
3. Design lineage, storage and transformation

Choose batch, streaming or hybrid architecture from freshness, volume, ordering, cost and recovery needs. Streaming adds state, replay and late-event complexity; do not use it solely because the source emits events. Separate acquisition, validated data, modeled data and presentation concerns so defects can be isolated. Make transformations version-controlled and deployable through reviewed changes.
Lineage should connect an output measure to source fields, transformation versions and run evidence. The W3C PROV-O recommendation offers an ontology for representing provenance entities, activities and agents. Teams do not need to implement the entire model to benefit from its discipline: record what data was used, which process changed it, when it ran and who or what was responsible.
The NIST Research Data Framework emphasizes themes including metadata, provenance, quality, FAIR principles, tools and cost. For enterprise analytics, the practical lesson is to design documentation and stewardship into the lifecycle. A catalog populated after launch will struggle to reconstruct business meaning and historical decisions.
4. Define and automate fit-for-purpose data quality
Data quality is contextual. ISO 8000-8 describes concepts and prerequisites for measuring information and data quality. The UK Government Data Quality Framework frames quality as fitness for purpose and recommends accountability, lifecycle assessment and clear communication. Translate that into rules tied to the decision, not universal perfection.
Measure dimensions such as completeness, validity, consistency, uniqueness, timeliness and accuracy where applicable. Each rule needs a purpose, population, calculation, target, severity and owner. Test at source entry when possible, then at ingestion, transformation and output. A dashboard should expose known limitations and last successful refresh. Do not silently replace missing values with zero or discard duplicates without understanding why they exist.
| Quality rule | Target and response | Owner |
|---|---|---|
| Order ID uniqueness | 100%; quarantine duplicates and stop affected aggregate | Order platform owner |
| Currency code validity | 100% approved codes; reject invalid events | Finance data steward |
| Carrier scan freshness | 95% within agreed window; flag degraded carrier feed | Logistics integration owner |
| Customer-region completeness | Target based on reporting use; route missing ownership | Customer data owner |
| Metric reconciliation | Within documented tolerance against finance close | Analytics product owner |
Use root-cause action plans rather than endless downstream cleaning. The Government Data Quality Framework guidance recommends tools including action planning, root-cause analysis, metadata and communication. Track how often a defect recurs and whether remediation changed the source process. Preserve transparent corrections and restatements so consumers can explain changed results.
5. Build a governed semantic and reporting layer
Define shared dimensions, measures, grain and time logic close to the governed model. Write plain-language metric definitions with formula, inclusions, exclusions, owner and worked examples. Avoid embedding slightly different “revenue” calculations in every dashboard. Version material definition changes and show effective dates. Historical reports may need the old definition for reproducibility while current operations use the new one.
Design reports around decisions and exceptions. Put status, comparison, threshold and drill path together; avoid pages of unrelated charts. Provide table exports where users legitimately need detailed work, while preventing uncontrolled copies of sensitive data. Show refresh time, filters and limitations. Test totals, edge cases, row-level access, keyboard operation and readable alternatives to color.
6. Protect data and manage privacy risk
Classify source fields and derived attributes. Limit collection to the stated purpose, restrict access by role and domain, and separate administrative privileges. Apply encryption, secret management, audit logs and protected nonproduction data. Row-level rules must be tested for direct query, exports, cached results and scheduled delivery. Aggregate views can still reveal individuals when groups are small or filters can be combined.
The NIST Privacy Framework provides a voluntary approach for identifying and managing privacy risk. Map data processing, purpose, affected people, sharing, retention and deletion. Review whether new joins create sensitive inference even if each source appears ordinary alone. Give data subjects and operational teams a route to correct records where applicable, and propagate approved corrections to analytical outputs.
7. Release, observe and recover the service
Test transformations with representative fixtures, schema changes, late data, duplicates and backfills. Reconcile outputs against authoritative totals with documented tolerances. Run parallel reporting across at least one meaningful business cycle for high-impact metrics. Assign go/no-go authority, rollback or report-withdrawal criteria and a communication plan for incorrect published results.
Operate pipelines as services. Monitor source arrival, schema, volume, quality rules, transformation duration, lineage, freshness and delivery. Alerts should route to the team able to act and distinguish delayed data from genuine zero activity. Maintain runbooks for replay, backfill, correction and consumer notification. Test recovery from lost orchestration state or corrupted intermediate data, not just infrastructure failure.
8. Drive adoption through trust and workflow integration
Train users on definitions, limitations and action paths rather than dashboard navigation alone. Embed analytics where decisions occur, such as a prioritized exception queue with assignment and resolution state. Maintain office hours or a feedback channel and publish definition changes. Retire superseded reports after confirming dependent workflows; leaving conflicting legacy reports live preserves disputes.
- Review usage by intended decision and role, not aggregate visits.
- Track questions, corrections and manual reconciliations as product signals.
- Compare decision time and outcome measures with the baseline.
- Prioritize source and definition defects that create the most business uncertainty.
- Revalidate access, quality thresholds and retention as use expands.
Estimate service cost by data product and decision domain. Include source extraction, storage, transformation compute, orchestration, catalog, observability, report capacity, support and change work. Attribute shared costs with a documented method and track expensive queries or retention that no longer serve an active use. Cost optimization should preserve lineage, quality evidence and recoverability; deleting intermediate data without considering replay can make the next correction slower and more expensive.
Treat metadata as a maintained interface. For each published dataset or metric, expose owner, description, grain, update time, sensitivity, lineage, quality state and support route. Automate technical metadata collection, but require domain owners to maintain business meaning. Measure unresolved ownership and stale definitions. A large catalog with no decision context can increase search effort while giving a false impression that governance is complete.
Key takeaways
- Start data and analytics services from a named decision, population and action owner.
- Make source authority, contracts, lineage and time semantics explicit.
- Measure quality against purpose and repair recurring defects at their source.
- Govern metrics in a shared semantic layer and communicate limitations.
- Operate analytics with security, recovery and feedback equal to any production service.
Frequently asked questions
Should platform selection come first?
No. Establish decisions, sources, freshness, volume, security and operating constraints first. Then evaluate whether existing capabilities meet them. Early platform commitment can force inappropriate modeling or migration before the team understands the service.
Can analytics create one source of truth?
It can create governed definitions and trusted views, but authority remains distributed across business systems and owners. The practical goal is one explainable definition for each decision context, with lineage and reconciliation, not one physical database containing everything.
Must data be perfect before launch?
No. It must be fit for the bounded purpose, with important defects measured and communicated. Launch may be acceptable with a known limitation and action plan if the decision owner accepts it. Hidden or unmeasured defects are different because users cannot judge the risk.
Conclusion
Reliable analytics connects a business decision to authoritative data through reproducible transformations, governed meaning and visible quality. Build that chain for a bounded domain, prove it under failure and correction, and measure whether work improves. Trust grows from explainable evidence and responsive ownership, not from the volume of data collected.