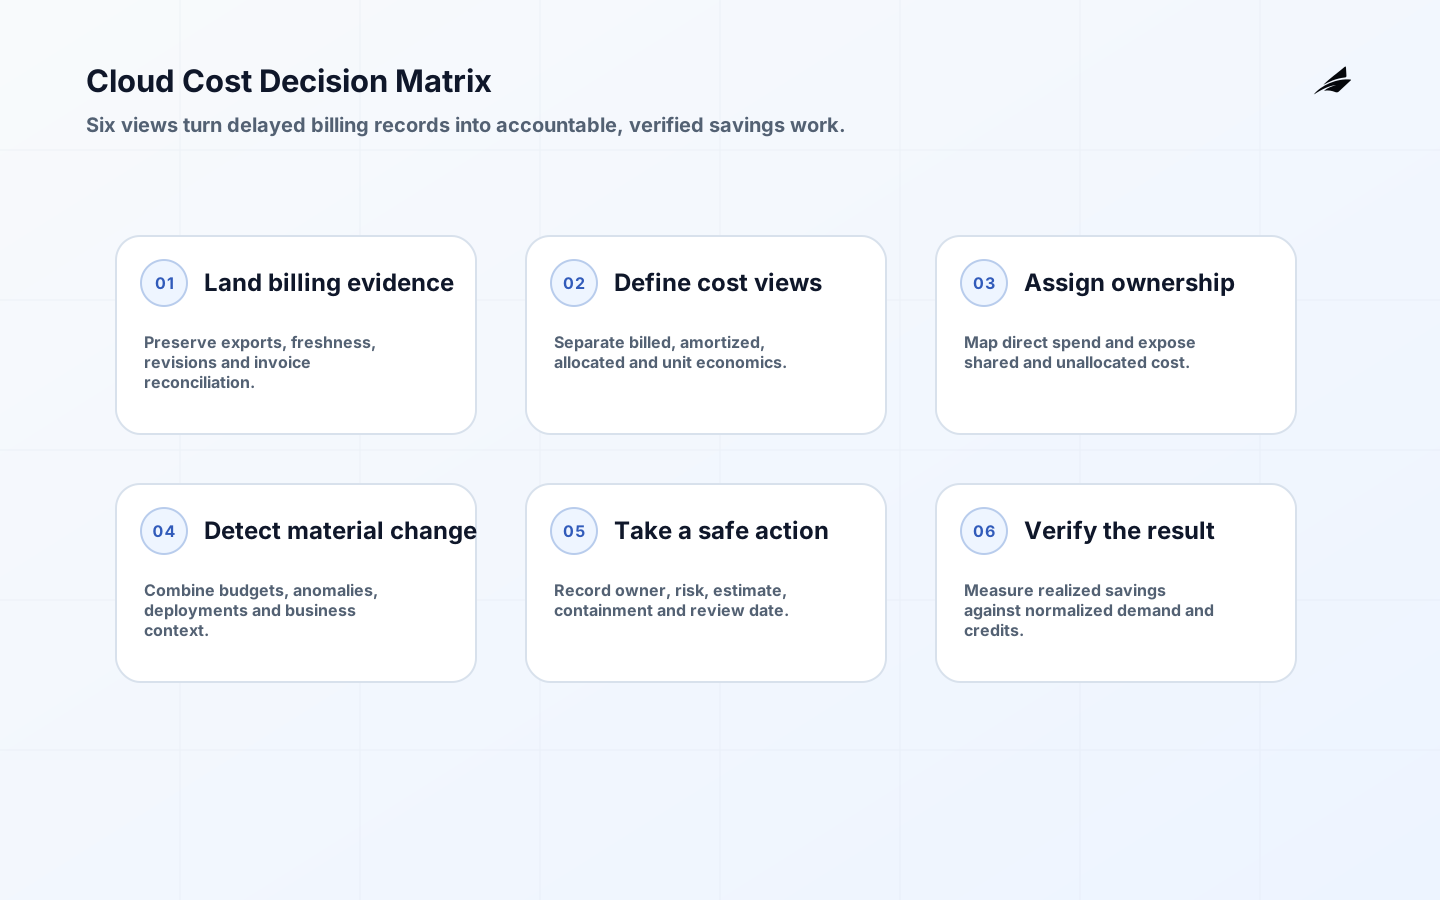
A cloud cost optimization dashboard for small business should lead to a decision, not simply display a bill in brighter colors. It needs trustworthy cost data, accountable allocation, business context, anomaly handling and a record of savings actions. A small team benefits most from a compact view that explains what changed, who owns it and what can be done safely.
Use this FAQ with the small-business cloud cost delivery plan, dashboard implementation checklist, general cost dashboard checklist and cloud cost dashboard FAQ. Start with a monthly review decision and then add detail only when it changes action.
What questions should the dashboard answer?
At minimum: What is month-to-date spend? What is the likely month-end range? Which service, environment or product changed? Is the change expected? Which owner can act? What commitment, credit or shared charge affects the figure? What action was taken, and did realized cost change afterward? Show freshness and last successful import so users do not mistake delayed billing for a sudden recovery.
Separate billed cost, amortized commitment cost and an internal allocated view. Finance may need invoice reconciliation while engineering needs daily resource detail and the owner needs cost per order, tenant or active user. Do not force one number to answer all three questions. Label currency, tax treatment, credits, forecast method and billing period clearly.
| Audience | Primary view | Decision |
|---|---|---|
| Owner | Monthly trend and unit cost | Adjust budget or product plan |
| Engineering | Service, resource and usage drivers | Rightsize, schedule or redesign |
| Finance | Billed, amortized, credit and invoice view | Accrue and reconcile |
| Operations | Anomaly, owner and service impact | Contain unexpected spend safely |
Which billing data should be used?
Use provider exports as the durable input rather than screen scraping. AWS Cost and Usage Reports provide detailed cost and usage line items and continue updating estimates until charges are finalized. Azure Cost Management exports can deliver recurring cost datasets and support FOCUS format. Google Cloud billing export sends detailed usage, cost estimates and pricing data to BigQuery.
Land exports unchanged in a restricted raw area, record file or partition identity, then transform into a versioned reporting model. Billing records can arrive late or be restated through credits, refunds and finalization. Reprocess affected periods idempotently instead of appending duplicates. Reconcile monthly totals to the provider's authoritative bill and document expected differences such as tax or support charges.
Should a small business normalize multi-cloud data?
Normalize when the business genuinely operates across providers or combines cloud with SaaS and data-center costs. The FOCUS 1.3 specification defines consistent dimensions and metrics for cost and usage data, including billed cost, resource and service fields, allocation fields and recency metadata. Preserve provider-specific columns needed for investigation rather than discarding detail to reach a lowest common denominator.
For one provider and a small estate, a thin provider-native model may be cheaper to maintain. Design semantic names that can later map to FOCUS, and isolate provider parsing from dashboard logic. Migration becomes manageable when charts depend on curated fields such as charge period, service, resource, owner, environment and effective cost rather than raw column names.
How should shared cost be allocated?
First allocate directly attributable cost through accounts, subscriptions, projects, resource groups and validated tags. Then identify shared platform, support, network and commitment costs. Choose a driver that reflects consumption or benefit, such as requests, active tenants, compute use or direct-cost share. Keep unallocated cost visible; arbitrary precision hides missing ownership and can start unproductive disputes.

Publish the allocation rule, effective date, owner and exception treatment. Version rules so historical reports remain explainable. The FinOps Framework frames cloud value as collaboration among engineering, finance and business roles. Hold a short monthly review where those roles accept material allocation changes and agree actions, instead of making the dashboard a finance-only artifact.
| Metric | Definition | Guardrail |
|---|---|---|
| Month-to-date actual | Effective cost through latest complete day | Show data freshness |
| Forecast range | Low, expected and high month-end estimate | Expose assumptions |
| Unit cost | Allocated cost divided by stable business unit | Show volume beside ratio |
| Anomaly | Change beyond service-specific expected band | Require owner and context |
| Realized savings | Measured cost reduction after action | Adjust for demand change |
How should budgets and anomalies work?
Use budget thresholds for planned limits and anomaly detection for unexpected shape. Notify an accountable owner with service, amount, likely driver, comparison period and investigation link. Tune by service because a batch workload and a stable database have different patterns. Avoid automatic production shutdown from a cost alert unless the workload is explicitly disposable; interruption can create larger losses and destroy diagnostic evidence.
Create a response path: confirm freshness, inspect usage and pricing dimensions, check deployment and traffic markers, classify expected or unexpected, contain safely, and record action. Track alert precision and time to owner acknowledgment. If every seasonal campaign is an anomaly, the model lacks business context. If no alert fires during a runaway loop, thresholds are too coarse or data arrives too slowly.
Which optimization actions belong in the dashboard?
Surface actions with owner, evidence, risk, estimated impact and review date. Common categories are idle-resource removal, scheduling non-production, storage lifecycle, data-transfer redesign, rightsizing, commitment coverage and application efficiency. Separate reversible housekeeping from architecture changes. A recommendation to reduce database size is incomplete without observed utilization, performance headroom, recovery path and a named service owner.
Measure realized savings against a normalized baseline after the action. Account for traffic and seasonality; a smaller invoice during lower demand is not automatically an optimization result. Keep avoided cost separate from cash savings. Close actions that no longer make sense so the backlog remains credible, and never reward teams for moving cost into another unmeasured account.
What is a sensible small-business implementation?
Schedule daily provider exports, load them into partitioned storage, validate schema and totals, transform a curated cost table, join an ownership registry and publish a small dashboard. Add budget and anomaly notifications to the team's existing work channel. Restrict raw billing access, particularly where account names or tags expose customer context. Monitor pipeline freshness, row counts, reconciliation difference and dashboard query cost.
Begin with four pages: executive month and forecast, service ownership, change and anomalies, and action tracking. Add resource-level drill-down as a linked diagnostic view rather than crowding the opening screen. Review the dashboard with real decisions for two billing cycles before investing in advanced forecasting or purchase recommendations.
Worked example: finding a small company's cost leak
A software company exports daily provider billing into a partitioned warehouse table and joins account, environment and product ownership. Its opening view shows billed and amortized cost, forecast range, cost per active tenant, unallocated percentage and top changes. The dashboard labels data complete through two days earlier because several services report late. Finance reconciles the prior month to the invoice and records a small expected difference for tax outside the reporting model.
An anomaly highlights a sharp increase in object-storage operations for the document product. The owner follows the linked drill-down and deployment marker to a new background job that repeatedly lists an entire bucket. The response does not delete storage or disable production. Engineering pauses the job, deploys a cursor-based implementation and observes operation count and queue completion. The action record states expected monthly impact, service risk, code change and review date.
At month end, the team compares post-change operations per document and cost at similar tenant volume. It reports realized savings separately from an expiring promotional credit. The same review finds unallocated support cost and agrees to distribute it by direct product cost from the next billing period, with a versioned rule. This compact workflow turns provider line items into an engineering fix, a reconciled finance view and an explainable ownership decision.
Dashboard acceptance evidence
- Successful recurring export and immutable raw landing with access restrictions.
- Schema, freshness and reconciliation controls with owned failure notifications.
- Documented definitions for billed, amortized, allocated and unit costs.
- Ownership registry and visible unallocated amount for the latest complete period.
- Versioned shared-cost rules approved by engineering, finance and business owners.
- Anomaly response record that links change, driver, owner, containment and service risk.
- Realized-savings calculation adjusted for demand, seasonality, credits and cost movement.
- Dashboard query and storage cost monitored so reporting does not become its own leak.
Key takeaways
- Build the dashboard from durable billing exports and reconcile it to the bill.
- Separate billed, amortized and allocated views.
- Keep unallocated cost visible and version allocation rules.
- Send anomalies to owners with context and a safe response path.
- Verify realized savings after accounting for demand and seasonality.
Frequently asked questions
Can provider-native tools be enough?
Yes, for a small single-provider estate with clear ownership. Export data anyway to preserve history and enable reconciliation. Add a custom model when business allocation, unit economics, multi-cloud comparison or action tracking exceeds native reporting.
How often should the dashboard refresh?
Daily is adequate for many small businesses because provider billing itself can be delayed or revised. Use faster operational usage signals for workloads where runaway spend can become material within hours, and clearly distinguish estimated usage from billed cost.
Should the dashboard show one forecast number?
A range is more honest. Show low, expected and high outcomes with traffic, seasonality and planned-change assumptions. Back-test forecasts monthly and explain material misses instead of adding false decimal precision.
Conclusion
A useful small-business cloud cost dashboard creates a repeatable decision loop from billing evidence to accountable action. Keep the data reconcilable, the allocation explainable and the views compact. The best dashboard is the one that helps owners change spend without weakening the service that earns revenue.