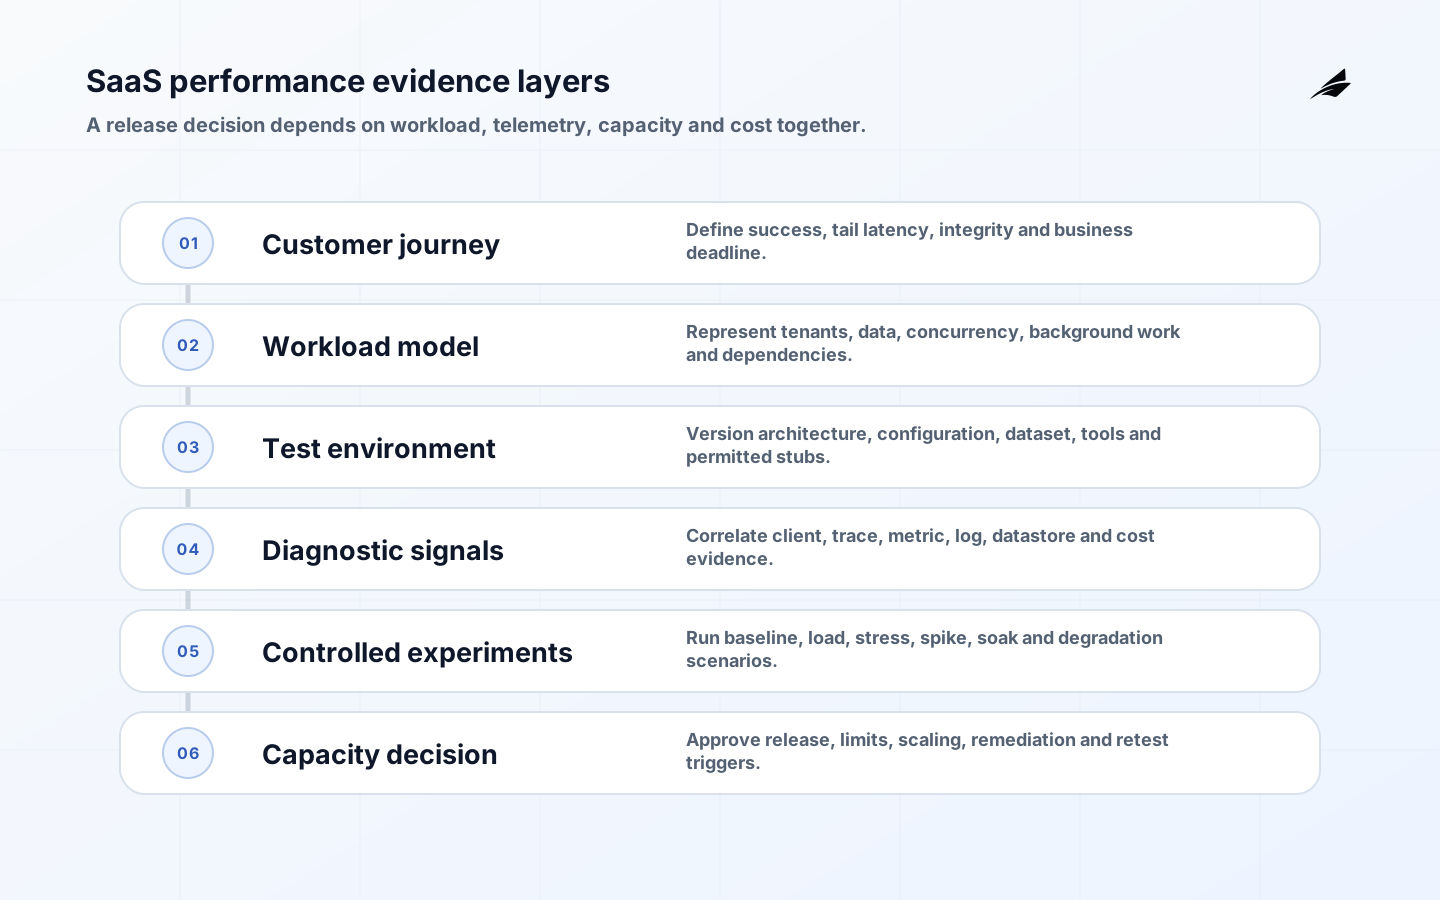
Performance testing for a SaaS development company should answer a release decision, not merely generate a requests-per-second chart. A credible program connects customer journeys, tenant and data variation, service objectives, production telemetry, capacity limits and cloud cost. It shows where the system bends, how it fails and whether recovery is safe. This guide defines scope, commercial choices, risks and a delivery sequence for that evidence.
Use the SaaS performance implementation checklist for detailed gates and the SaaS performance FAQ for common questions. The adjacent performance testing implementation plan and managed testing service guide help compare project and ongoing-service models.
Define performance from customer journeys
Choose actions whose speed or capacity changes customer value: sign-in, search, checkout, API write, file import, report generation, billing run or webhook delivery. For each, define start, successful end, failure, eligible population and latency threshold. Google's service level objective guidance recommends beginning with user needs rather than convenient measurements. A database query benchmark is useful only when its relationship to the journey is understood.
State the business question and release gate. Examples include supporting 4,000 concurrent sessions at an agreed tail latency, completing a monthly close within its window, or onboarding a tenant with 50 million records without harming others. Record current baseline, target, forecast horizon and consequence of missing it. Include availability and correctness because a fast error or stale report is not successful performance.
| Test objective | Representative measure | Decision enabled |
|---|---|---|
| Interactive responsiveness | Journey p50, p95 and p99 latency with success ratio | Approve experience for the target cohort |
| Sustained capacity | Completed work and resource saturation over hours | Size steady operation and on-call thresholds |
| Burst resilience | Queue age, rejection and recovery after spike | Set admission control and buffer policy |
| Tenant isolation | Latency and errors by tenant workload class | Approve noisy-neighbor controls |
| Batch window | Correct records completed before deadline | Approve schedule, partitioning and fallback |
Model workload, tenants and data realistically
Derive load from production analytics, forecasts and product behavior. Model arrival rate, concurrency, think time, session length, payload, read-write mix, cache state, background jobs and geographic distribution. Avoid multiplying average traffic by a guessed factor. Peak behavior often comes from synchronized schedules, retries, imports or one large tenant rather than evenly distributed users. Preserve the assumptions so a future test can explain why results changed.
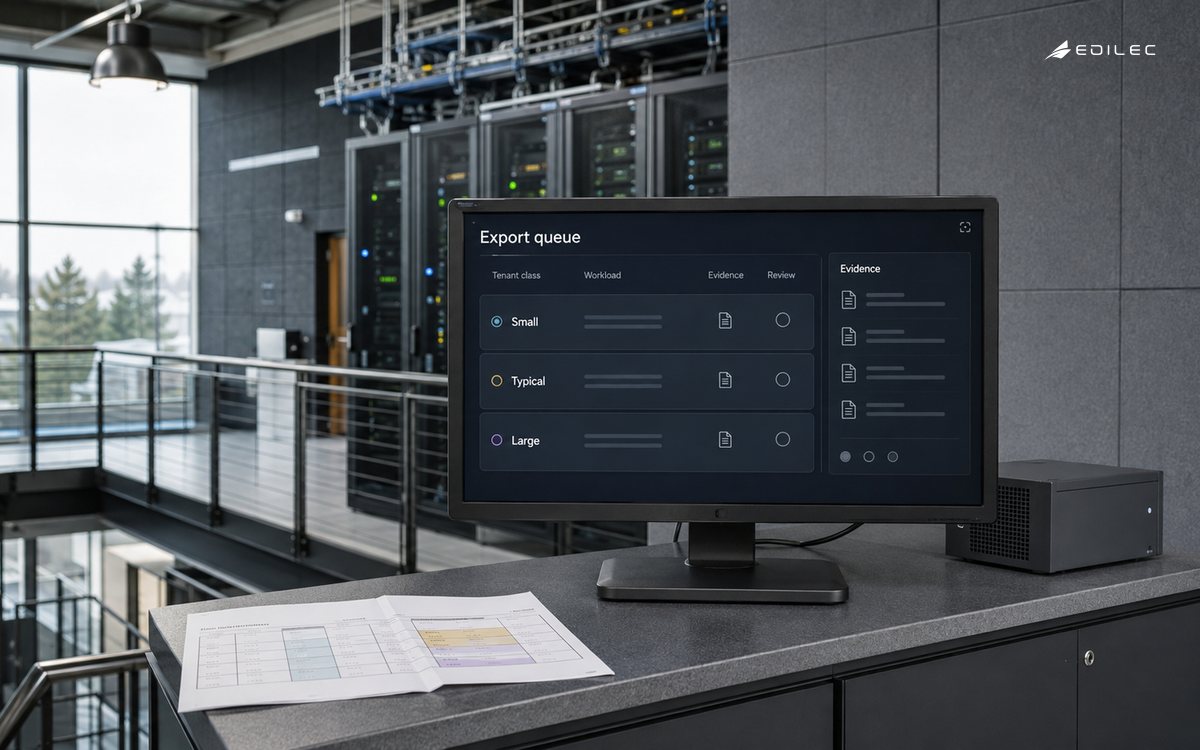
Create workload classes for small, typical and large tenants, including skewed data and permissions. Use production-like cardinality, indexes and retention without copying sensitive records. Generate deterministic synthetic data with referential integrity and known expected results. Warm and cold cache scenarios both matter. Seed the same dataset for comparisons, then add controlled variation to expose threshold effects. Masked data still needs privacy review and restricted access.
Build a trustworthy test environment
Match the production architecture where it affects behavior: runtime class, database engine and settings, network path, autoscaling, queues, external-service limits and observability. A smaller environment can be valid when scaling assumptions are explicit and bottlenecks are not distorted. Record infrastructure, application, schema, configuration, data and test-tool versions for every run. Prevent unrelated jobs and shared test traffic from contaminating results.
Stub a dependency only when the test question does not require its real latency, error or rate limit. Configure the stub from measured distributions and include failure modes. For third-party testing, obtain permission, respect terms and coordinate windows. Never direct uncontrolled load at production. A limited production experiment can be appropriate after lower environments pass, provided exposure, monitoring, abort authority and customer risk are explicitly governed.
Instrument the path before generating load
The OpenTelemetry signal model covers traces, metrics, logs and baggage. Use traces to follow a sampled request across services and queues, metrics for rates and resource distributions, and logs for material events. Correlate test scenario, release and tenant class through safe attributes. Control cardinality and exclude secrets or personal content. If the team cannot explain where time went during a small run, a large run will only produce a larger mystery.
Measure at client, edge, application, dependency and datastore. For web journeys, the W3C Navigation Timing Level 2 specification defines browser timing attributes that separate navigation phases. Combine synthetic browser results with server traces so network, rendering and backend delay are not conflated. Track CPU, memory, garbage collection, threads, connections, cache, locks, I/O, queue depth and quota consumption according to the architecture.
| Experiment | Shape | Evidence retained |
|---|---|---|
| Baseline | Expected steady workload | Latency distribution, success, utilization and cost |
| Load | Increase toward forecast demand | Scaling behavior and first constraint |
| Stress | Continue beyond target under control | Failure mode, protection and saturation point |
| Spike | Rapid increase and decrease | Admission, queue, autoscaling lag and recovery |
| Soak | Sustained representative load | Leaks, drift, compaction and cumulative cost |
| Degradation | Inject dependency delay or loss | Timeout, retry, fallback and blast radius |
Run experiments in a controlled sequence
Start with a functional smoke test and low-load calibration. Run a repeatable baseline, then change one material variable at a time. Ramp gradually, hold long enough for caches and autoscaling to stabilize, and cool down between runs. Record start and stop, workload, environment, anomalies and operator interventions. Repeat important runs to distinguish an improvement from normal variation. Abort on integrity, safety, uncontrolled cost or agreed service thresholds.
Test retries and timeouts as a system. A dependency slowdown can cause request amplification, connection exhaustion and a retry storm. Use bounded retries with backoff and jitter where the operation is safe, enforce deadlines and make writes idempotent. Exercise load shedding, circuit behavior and degraded modes. Verify recovery after load falls; a system that stays saturated or drains an invalid queue slowly may miss the business objective long after the spike.
Translate results into capacity and release controls
Identify the limiting resource and its relationship to completed work. Capacity includes quotas and serialized operations, not only CPU. Forecast demand by scenario and include growth, seasonality, release effects and safety margin. Document the range where test evidence supports interpolation; do not extrapolate linearly through a bottleneck. Re-run after architecture, data distribution or major dependency changes.
Kubernetes Horizontal Pod Autoscaling periodically adjusts replicas from configured resource or custom metrics. Tests must account for startup and readiness, metric delay, stabilization and downstream capacity. CPU may be a poor signal for queue-driven work. Choose a metric that leads customer impact, set minimum and maximum bounds, and verify that scaling one tier does not overload a fixed database or vendor API.
The AWS Performance Efficiency guidance calls for efficient resource use as demand and technology change, including load testing and regular metrics review. Whatever cloud is used, pair performance with cost per completed action. An improvement that doubles infrastructure for a negligible tail-latency benefit may not serve the product. Preserve reliability and data safeguards while optimizing.
Scope the engagement and compare cost models
A focused engagement includes objective definition, workload and data design, environment review, instrumentation, test implementation, experiments, bottleneck analysis, remediation verification and handover. Exclude broad refactoring unless separately approved. Define how many journeys, regions, tenant classes and rounds are included. Name who changes application code, provisions capacity and accepts risk. Require scripts, datasets, dashboards and results in client-controlled systems.
Fixed price works for known journeys and environment; time and materials fits exploratory bottleneck work; a retainer supports recurring release and seasonal tests. Budget test infrastructure, data generation, observability, commercial tools, third-party charges and engineering remediation. Compare cost against the decision value. The cheapest test that omits production-like data or diagnosis can create expensive false confidence.
Implementation example: multi-tenant analytics export
A SaaS analytics company promises exports within 15 minutes but sees intermittent delays near month-end. Production evidence shows synchronized schedules, three tenant size classes and an external object-store limit. The test model combines interactive dashboard traffic with export arrivals and realistic data skew. Traces reveal a serialized metadata update; simply adding workers increases lock wait and storage requests.
The team shortens the transaction, partitions scheduling and adds bounded tenant concurrency. A custom autoscaling signal follows oldest eligible job age, while a global limit protects the datastore. Baseline, spike and four-hour soak runs pass the journey objective with integrity checks. Cost per export falls because workers spend less time blocked. Release uses a feature flag by tenant cohort, with queue age and error-budget triggers for rollback. The retained test becomes part of monthly-close readiness.
Key takeaways
- Frame tests around customer journeys and explicit release or capacity decisions.
- Model tenant, data, background work and dependency variation from evidence.
- Instrument every material layer before increasing load.
- Run baseline, stress, spike, soak and degradation experiments with controlled variables.
- Treat autoscaling, retries, queues and fixed downstream limits as one system.
- Retain reproducible tests and relate performance to correctness, reliability, recovery and cost under stated demand.
SaaS performance testing FAQ
How often should tests run? Run small regression tests in delivery pipelines and fuller experiments before material architecture, data or demand changes. Repeat seasonal scenarios before the relevant event.
Can production traffic be replayed? Only after privacy, authorization and side-effect controls. Prefer sanitized or synthetic scenarios and ensure writes cannot reach real customers or suppliers.
What is a passing result? Meeting pre-approved journey success, latency, integrity, recovery and cost criteria under the stated workload and environment. A peak throughput number alone is not a pass.
Conclusion
A SaaS performance program is valuable when it converts realistic demand into a defensible product decision. Define the journey, reproduce the workload, observe the complete path, expose the constraint and verify remediation. Keep the evidence versioned and reusable. Revisit workload assumptions after major pricing, feature, tenant, data or infrastructure changes, and compare production behavior with the tested envelope. That discipline replaces heroic scaling guesses with a tested, reviewed capacity and release plan that teams can explain, verify and update.