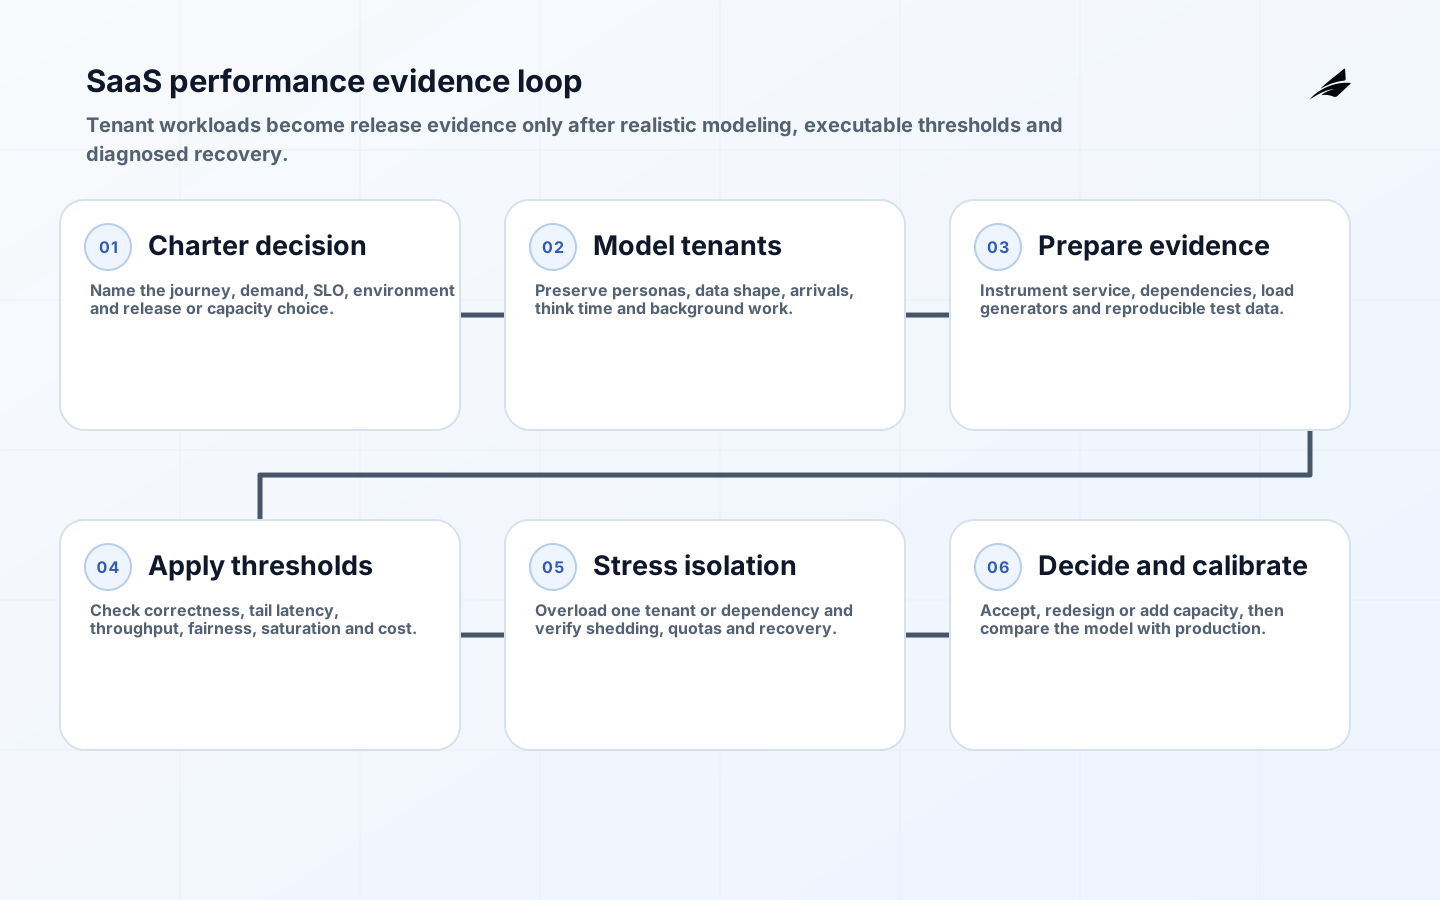
Performance testing for a SaaS product answers a business question: can the service preserve an acceptable customer experience as tenants, data and concurrency change? A single requests-per-second target is rarely enough. Multi-tenant systems contain different plans, feature mixes, data sizes and automation patterns. One tenant may create short interactive requests while another runs expensive exports or synchronized jobs. A credible test reproduces those relationships, measures the whole user journey, identifies the first constrained resource and proves what the service does when capacity is exceeded.
The purpose is not to create an impressive graph. Test results should support a release, capacity or architecture decision. Grafana k6 defines thresholds as pass/fail criteria over test metrics, while Google SRE guidance connects load testing with capacity planning and failure behavior. AWS's SaaS Lens adds the multi-tenant concern: a SaaS architecture must detect consumption trends and prevent one tenant from degrading others. Combine these ideas into a repeatable evidence loop: define the service promise, model realistic demand, observe the system, compare results with thresholds and either accept the release or change the design.
What should a SaaS performance test prove?
Write a test charter before a script. Name the user journey, tenant profile, expected demand, service-level objective, environment, duration and decision. For example: determine whether the order-import service can process the projected enterprise-tier morning peak while interactive users remain within their latency objective and no tenant waits beyond the queue-age limit. This statement is stronger than 'test 10,000 users' because it says what work occurs, who may be affected and what result is acceptable. Link it to the performance testing scope guide and the implementation checklist so tests remain attached to release decisions.
Define success at several layers. User measures include journey completion and percentile latency. Service measures include error rate, saturation and queue delay. Tenant measures include fairness, throttling and isolation. Business measures include completed jobs, successful checkouts or reports produced on time. Resource measures show CPU, memory, database connections, storage throughput and external quotas. Average latency can hide a poor tail, and infrastructure utilization alone cannot show whether customers completed work. Use percentiles and error classifications, but preserve enough traces and logs to explain why a threshold failed.
| Test type | Question | Typical decision |
|---|---|---|
| Baseline | What does a known workload cost today? | Detect regression after a change |
| Load | Can expected peak demand meet SLOs? | Release or capacity approval |
| Stress | Where is the breaking point and how does failure appear? | Set limits and overload controls |
| Spike | Can sudden demand be absorbed or shed safely? | Tune scaling and queues |
| Soak | Does performance decay over hours? | Find leaks, backlog and compaction effects |
| Isolation | Can one tenant harm another? | Apply quotas, pools or siloing |
How do you create a realistic workload model?
Derive the model from production telemetry, product analytics and forecasts. Group requests into journeys rather than replaying URLs uniformly. Preserve think time, session length, tenant distribution, payload sizes, cache state and asynchronous work. Model both open arrivals, where work reaches the service independently of response time, and closed user loops, where each virtual user waits before continuing. An inappropriate closed model can hide overload because slow responses automatically reduce generated traffic. For scheduled integrations or webhooks, an arrival-rate model is often closer to reality.

Create named tenant personas: small interactive tenant, enterprise tenant with a large dataset, automation-heavy tenant and administrator performing broad queries. Include tier-specific limits and permissions. Use synthetic or de-identified data with the same cardinality and shape as production; ten rows cannot reveal an index failure that appears at ten million. Exercise cache-cold and cache-warm behavior. Include realistic downstream latency and failure, but coordinate carefully before driving load at third-party services. Where external testing is not authorized, use a controlled substitute with measured response distributions.
Does performance testing need a production-sized environment?
Not every test needs full production scale, but the environment must support the decision. A small environment can detect code regressions when its resource ratios and data shape are stable. It cannot establish absolute production capacity if database topology, network paths, autoscaling behavior or managed-service quotas differ materially. Document every difference and avoid multiplying a result by instance count without evidence. Distributed systems can have nonlinear bottlenecks: lock contention, partitions, queue behavior and shared control planes do not scale in simple proportion.
For a high-consequence launch, run a production-like test and, where operationally safe, controlled production exercises with strict limits. Isolate test tenants, prevent real notifications or charges, and monitor downstream systems. Start below expected demand, increase in steps and hold long enough for scaling, caches and background work to settle. Abort when safety thresholds are crossed. Preserve configurations, test code, dataset version and build revision so another team can reproduce the result. A test without reproducibility becomes an anecdote.
Which thresholds and telemetry matter?
Translate SLOs and release requirements into executable thresholds. k6 can fail a run when an error rate or percentile exceeds a condition, which makes the result usable in a delivery pipeline. Avoid one global latency threshold. Apply thresholds to critical journeys, tenant tiers and operations, and pair them with minimum throughput or completion requirements. A fast response that returns an empty result is not success. Include queue age, background completion, retry rate and data correctness where work continues after the HTTP response.
Instrument the path before running the test. OpenTelemetry distinguishes traces, metrics and logs; each answers a different question. Metrics reveal saturation and trend, traces connect latency across services, and logs preserve important events and error context. Add tenant and test-run identifiers while controlling cardinality and sensitive data. Correlate load-generator time with server time. Observe the load generators too, because an exhausted generator can make the system look healthier than it is. Record autoscaling events, database plans, garbage collection, connection pools, quotas and dependency latency.
| Evidence | Pass example | Diagnostic value |
|---|---|---|
| Journey latency | p95 and p99 within the agreed objective | Shows customer-visible tail |
| Correct completion | Expected records or transactions reconcile | Detects fast but wrong behavior |
| Tenant fairness | No unaffected tier breaches its objective | Reveals noisy-neighbor impact |
| Saturation | Headroom remains at projected peak | Identifies constrained resource |
| Recovery | Queue and latency return within a time limit | Shows whether overload persists |
| Cost | Resource cost per completed unit is acceptable | Prevents capacity by uncontrolled spend |
How should a SaaS system behave beyond capacity?
A stress test is successful when it reveals a controlled failure mode, not when the service never fails. Google SRE recommends testing the capacity limit and overload behavior. The system should reject work early and cheaply, bound queues, apply timeouts, use retries with exponential backoff and jitter, and shed optional work before critical work. Unbounded retries can turn a small error rate into a cascading failure. Test a partial dependency outage and confirm that circuit breakers, concurrency limits and degraded modes preserve the core journey.
Test noisy-neighbor controls explicitly. Drive one tenant beyond its purchased or safe allocation while representative tenants continue normal work. Verify per-tenant quotas, fair queues, rate limits and resource pools. Some services may require targeted siloing for expensive workloads, but dedicated infrastructure adds operational cost. The right result is not identical performance for every tenant; it is predictable service according to documented tiers, with one tenant unable to consume unbounded shared capacity. Confirm that throttling messages and retry guidance are usable by client developers.
When should performance tests run?
Run small regression tests in the delivery pipeline for high-risk paths, scheduled load tests against representative environments, and deeper stress or soak tests before material launches and architecture changes. Trigger focused tests when query patterns, dependencies, data models, caching, runtime versions or infrastructure change. Maintain test code like product code: review it, version it and remove obsolete journeys. Compare results with a stable baseline and explain meaningful variance rather than resetting the baseline whenever a test fails.
Turn failures into owned work. The report should state the test question, model, environment, result, bottleneck, customer consequence, confidence and next decision. Do not present every metric. Attach traces and dashboards for investigation, then summarize the evidence a release owner needs. After production launch, compare observed demand and latency with the test model. Differences improve the next forecast and expose missing scenarios. Performance engineering is a calibration cycle, not a one-time certification.
Key takeaways
- Define each test around a release or capacity decision.
- Model journeys, tenants, data shape and arrival patterns realistically.
- Use executable thresholds for correctness, latency, fairness and recovery.
- Instrument traces, metrics and logs before generating load.
- Test overload and noisy-neighbor controls, not only expected traffic.
Frequently asked questions
How many virtual users should a SaaS load test use?
There is no universal number. Derive concurrency or arrival rate from measured journeys, peak forecasts and tenant behavior. A small number of automation clients can create more work than thousands of interactive sessions, so model requests and backend cost rather than relying on user count alone.
Can performance tests run in CI?
Yes, focused regression tests with stable data and thresholds fit CI well. Large load, stress and soak tests usually need scheduled or pre-release environments because they cost more and can interfere with shared systems. Keep the same versioned scenarios across levels.
Is average response time useful?
It can describe a broad trend, but it conceals tail latency and mixed journeys. Use percentiles, error rates and correctness by operation and tenant profile. Investigate the distribution instead of treating one aggregate as the customer experience.
Conclusion
Professional SaaS performance testing connects workload, service promise and operational decision. A trustworthy result shows not only how much load the system handled, but which tenants and journeys remained healthy, where capacity ended, how failure was contained and how quickly the service recovered. Build that evidence into normal delivery and capacity planning, and performance stops being a late launch obstacle and becomes a design input.