A SaaS performance testing checklist should answer a release question: can the service meet defined user outcomes for representative tenants, data and concurrency with enough capacity and diagnostic evidence to operate safely? A single requests-per-second score cannot answer it. SaaS behavior depends on workload mix, tenant isolation, caches, queues, databases, third-party calls, background jobs, deployment state and the location from which latency is observed.
Use this checklist when establishing a performance practice or evaluating a SaaS development partner. The SaaS performance scope and cost guide helps plan an engagement; the performance testing FAQ covers common buying questions. Teams starting with a broader test program can use the SaaS implementation testing plan.
1. Define performance outcomes and service objectives
Identify critical user journeys and asynchronous outcomes: sign-in, search, checkout, report generation, import, webhook delivery or model execution. Define the observation point, percentile, time window, success criteria and valid exclusions. For example, “99 percent of accepted interactive searches complete within 800 milliseconds at the public edge over a rolling 28 days, excluding customer-cancelled requests” is more actionable than “fast search.” Pair latency with availability, correctness and freshness so a quick error is not counted as success.
Google’s SRE guidance on service-level objectives recommends choosing indicators that matter to users and using error budgets to balance reliability with change. Translate production objectives into test thresholds with realistic margin rather than promising that laboratory results equal live behavior. Define capacity objectives too: maximum active tenants, concurrent sessions, queue age, ingest rate, data volume and scheduled-job completion by a business deadline.
| Outcome | Precise test measure | Guardrail |
|---|---|---|
| Interactive response | p50, p95 and p99 successful latency from chosen edge | Error rate and response correctness |
| Background completion | Queue wait plus execution time by job class | Retries, duplicates and dead letters |
| Tenant isolation | Victim-tenant latency during noisy-neighbor load | Per-tenant errors and resource shares |
| Scalability | Sustained throughput before objective breach | Autoscaling delay and cost per transaction |
| Stability | Objective attainment during soak duration | Memory, connection and storage growth |
| Recovery | Time to regain objectives after injected failure | Data loss and backlog drain time |
2. Build a production-shaped workload model
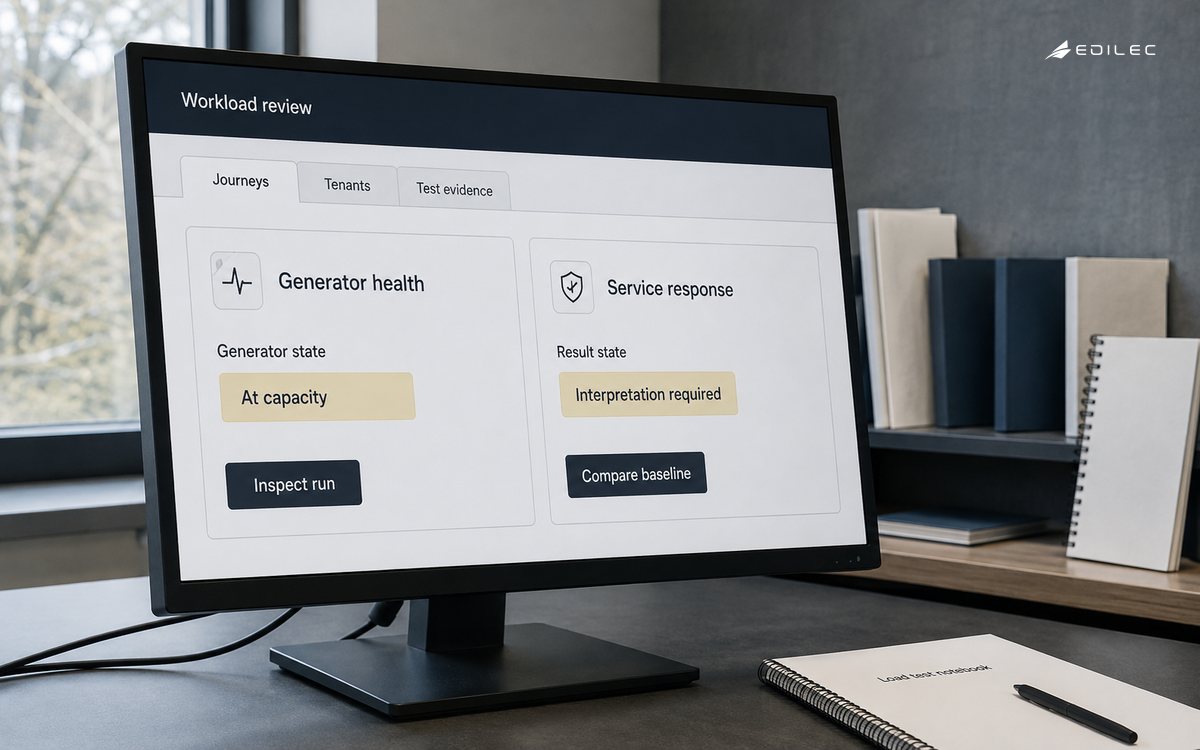
Derive the mix from privacy-safe production telemetry and business forecasts. Include arrival patterns, think time, session length, payload distribution, data cardinality, cache warmth, tenant sizes, geographic origins and background schedules. Model a normal peak, expected growth, launch burst, large tenant and abusive or accidental hotspot. Preserve correlations: search volume may rise after imports, and billing jobs may collide with customer reporting. Uniform random calls often miss the contention created by real sequences.
Seed data with production-like shape, not just row count. Query plans depend on skew, selectivity, relationships and historical depth. Use distinct credentials and records for virtual users so caching or locking behavior is credible. Respect protocol semantics; RFC 9110 defines HTTP method properties and caching semantics that affect safe retries and intermediary behavior. A script that repeats unsafe writes or ignores cache headers can measure an invented system.
3. Instrument the whole request path
Collect client timing, edge and application latency, errors, traces, database waits, queue age, pool saturation, runtime pauses, cache behavior, host or container resources and autoscaling events. Tag telemetry with service, version, environment, region, operation and bounded tenant class. Avoid unbounded identifiers that create costly high-cardinality streams. OpenTelemetry’s metric semantic conventions define common naming, units and attributes; consistent instrumentation makes comparisons and trace correlation more reliable.
Measure the load generator as well. CPU, network, connection or file limits on the generator can create a false plateau. Synchronize clocks and record configuration, build identifier, infrastructure version and test-data snapshot. Confirm telemetry sampling preserves errors and slow traces. Create dashboards before the test, including objective lines and saturation signals. A test without diagnostic visibility can identify a symptom but wastes the expensive opportunity to explain it.
4. Use a portfolio of test types
Run a baseline for repeatable comparison, a load test at expected peak, a stress test to find the objective boundary, a spike test for abrupt demand, a soak test for accumulation and a failure test for recovery behavior. Add tenant-isolation and data-volume scenarios. Not every build needs every test; map test depth to change risk. A query-index change may need focused data-shape tests, while a queue redesign or regional topology change needs broad failure and soak evidence.
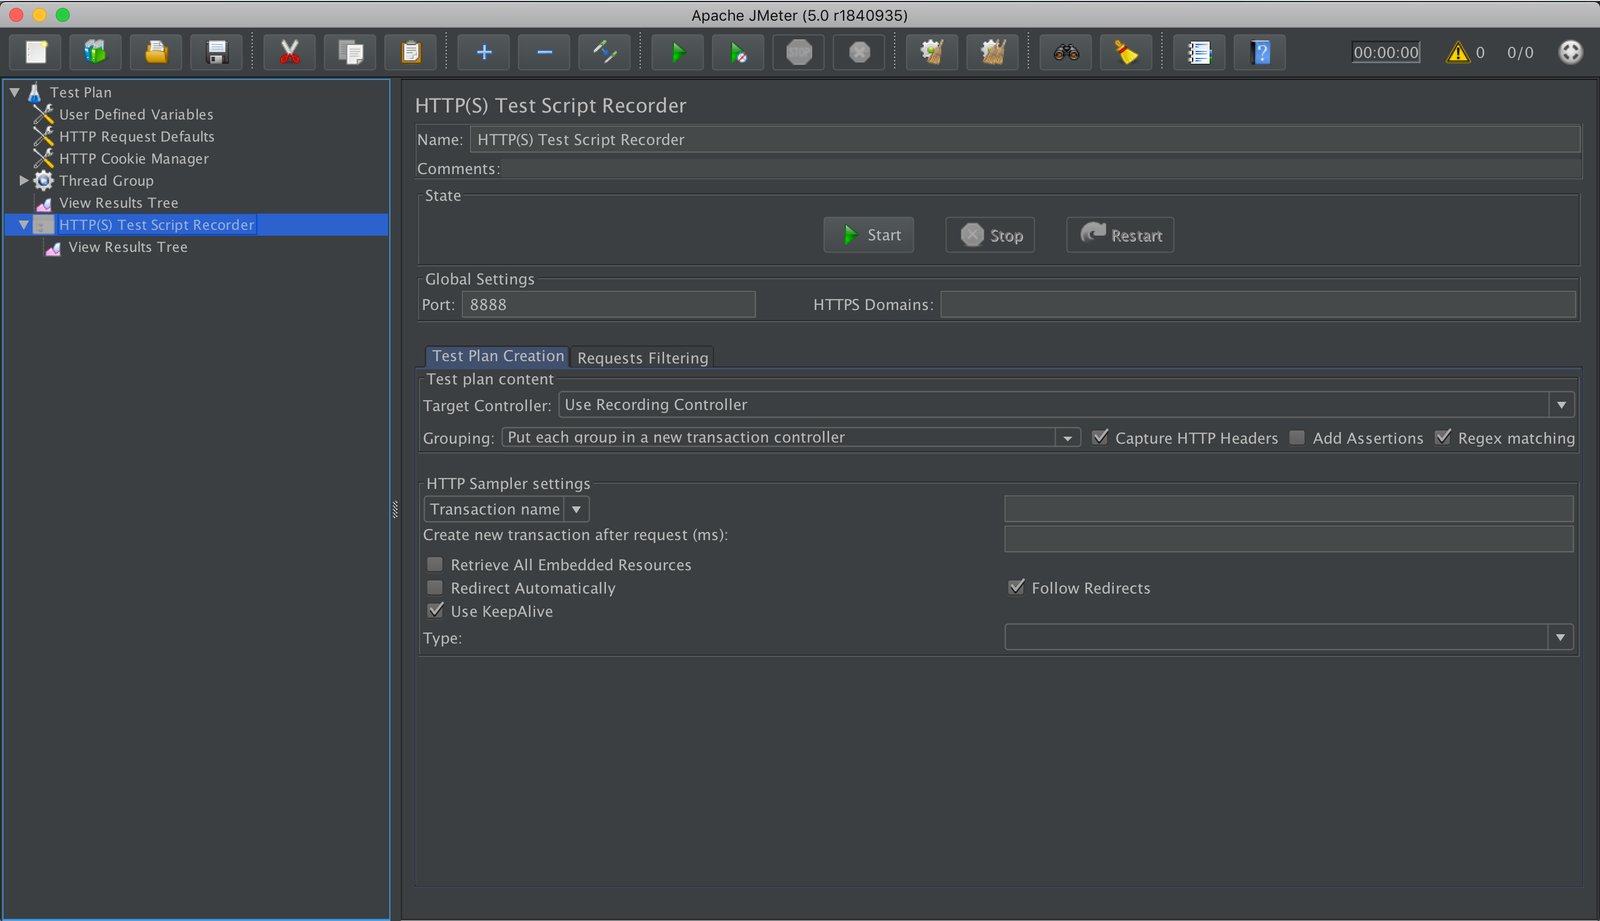
Warm up runtimes, caches and autoscaling according to the scenario, then exclude warm-up only when the user experience genuinely does. Ramp arrival deliberately and sustain long enough to reach steady state. The Apache JMeter best-practices guide warns that incorrect thread sizing can produce coordinated omission and recommends non-GUI execution with restrained listeners for large tests. Whichever tool is used, validate its scheduling model and capacity with an independent counter.
| Test | Question answered | Common invalidation |
|---|---|---|
| Baseline | Did a known build change under fixed conditions? | Different data, infrastructure or warm state |
| Peak load | Can expected demand meet objectives sustainably? | Unrealistic request mix or short duration |
| Stress | Where and how does the service degrade? | Generator saturation mistaken for server limit |
| Spike | Can admission and scaling absorb abrupt demand? | Unlimited retries amplify the test |
| Soak | Do resources, queues or costs drift over time? | Duration too short for scheduled work |
| Failure | Does the service recover within objectives? | Failure injected without validating user impact |
5. Control the environment and analyze bottlenecks
Use an isolated, production-like environment for release evidence where feasible, with matching topology, limits, autoscaling policy and managed-service tiers. If scale is reduced, document which bottlenecks do and do not scale linearly. Prevent unrelated deployments and noisy test traffic. Keep secrets and personal data out of scripts and results. Record third-party stubs versus live dependencies; a stub improves repeatability but cannot establish the provider’s real latency or quota behavior.
Analyze latency as a distribution and decompose it across the path. Correlate objective breaches with saturation, queueing, lock or connection waits, garbage collection, downstream calls and scaling transitions. Compare repeated runs and report uncertainty; one favorable result is not a trend. The Google Cloud performance pillar describes performance as a continuous cycle of requirements, design, monitoring and optimization. Preserve findings as owned engineering work, then rerun the decisive scenario.
6. Set release gates and capacity actions
A gate should identify build, scenario, environment, thresholds and authorized exception. Require objective attainment, acceptable error and correctness, no unexplained saturation, stable soak trends, bounded recovery and an approved cost range. Store raw and summarized results with configuration. Fail closed for material regressions; an exception needs impact, owner, expiry and mitigation. Do not average a new build with old results to conceal degradation.
Convert results into a capacity model: demand unit, current safe capacity, headroom, scaling lead time and next constraint. The AWS performance-efficiency pillar emphasizes selection, review, monitoring and trade-offs. Revisit the model after architecture, tenancy or workload changes. Test in production cautiously through canaries, shadow traffic or controlled experiments, with stop conditions and customer safeguards. Feed production observations back into scripts.
Create a reproducible performance run record
Every decision-grade run needs an immutable summary linking the code build, infrastructure revision, service configuration, data snapshot, workload script, generator topology, start and end time, objective thresholds and raw results. Record warm-up, exclusions, anomalies and whether dependencies were real or stubbed. This lets another engineer reproduce the result and prevents teams from comparing tests that share a name but not the same conditions. Store the approved record beside release evidence so later incidents can test the capacity assumptions that supported deployment.
Include an analysis that identifies the first objective breached, the saturation or wait signal associated with it, safe capacity under the modeled mix and the next expected constraint. State uncertainty when runs vary. Link the resulting engineering action and the confirming rerun. Retain enough telemetry for diagnosis while applying access and retention controls to traces or payload-derived data.
- Pin build, configuration, infrastructure and data shape.
- Version workload mix, arrival model, credentials and generator placement.
- Preserve percentile, correctness, saturation and cost results together.
- Record invalidating events such as generator limits or unrelated deployments.
- State safe capacity and scaling lead time for the tested workload.
- Require a confirming run for any optimization used to approve release.
Key takeaways
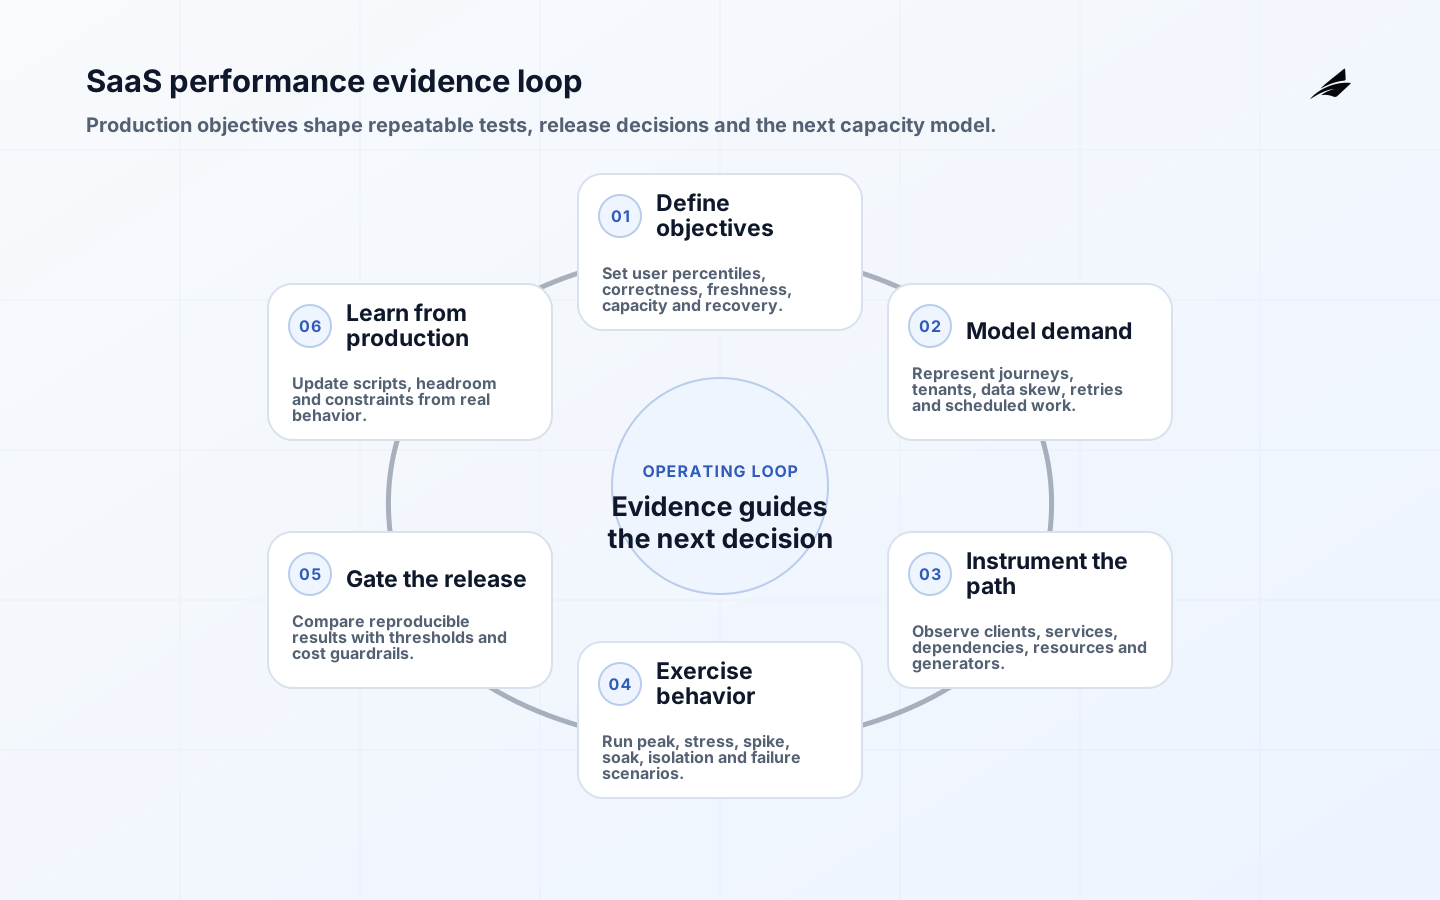
- Define user-centered percentiles, correctness, freshness and capacity before scripting traffic.
- Model tenant mix, data skew, journeys, retries and scheduled work from evidence.
- Instrument client, service, dependencies, resources and the load generator with consistent semantics.
- Use baseline, peak, stress, spike, soak, isolation and failure tests according to change risk.
- Gate releases on reproducible evidence and turn each run into a maintained capacity model.
Frequently asked questions
Should performance tests run in production?
Controlled production experiments can reveal real topology and demand, but they require authorization, bounded traffic, synthetic or protected data, monitoring and immediate stop conditions. Use pre-production for destructive stress and repeatable release gates; use production canaries to validate assumptions safely.
How many concurrent users should be tested?
Derive concurrency from arrival rate, session behavior, response time, tenant distribution and forecast rather than selecting a round number. Test expected peak and credible growth, then find the objective boundary. Report the workload mix with the number because concurrency alone is ambiguous.
How often should the full suite run?
Run fast focused checks on relevant changes, scheduled baselines often enough to detect drift, and broader peak, soak and failure suites before high-risk releases or major demand events. Frequency should match change rate, consequence and test cost.
Conclusion
Credible SaaS performance evidence begins with user outcomes and a realistic workload, not a tool. Instrument the path, exercise distinct failure and demand modes, control the test system and preserve repeatable release gates. When production feedback continuously reshapes the model, performance testing becomes an operating capability rather than a pre-launch spectacle.