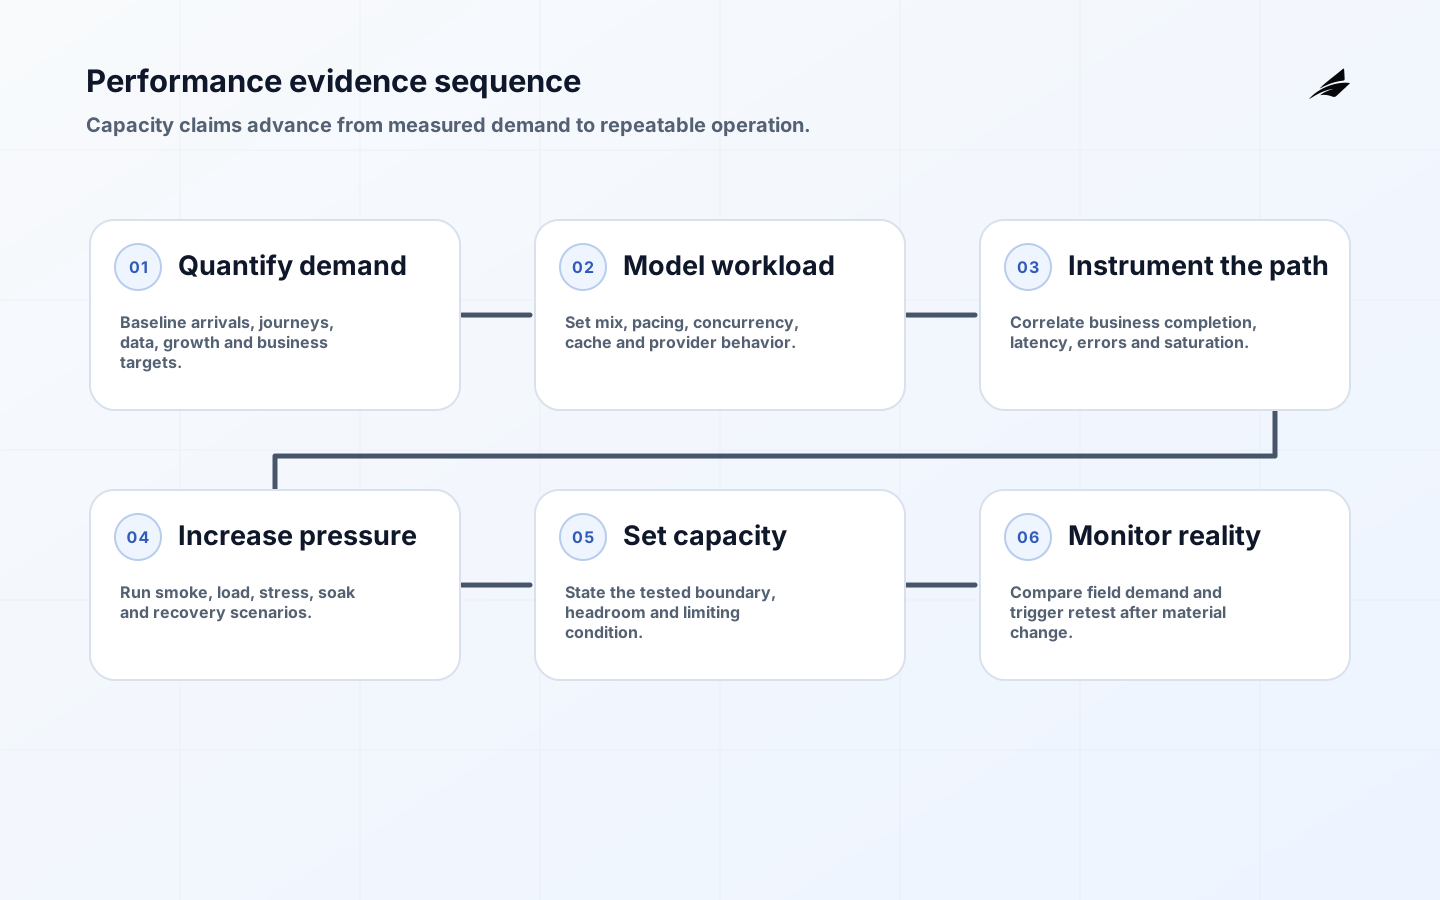
Performance testing services create controlled evidence about how a system behaves as work, data and failure pressure increase. A credible engagement does more than generate requests and report average latency. It models user and machine workloads, defines business thresholds, observes the complete request path, identifies constraints and records the capacity assumptions under which results are valid.
Use this FAQ with the performance testing services checklist and the SaaS performance testing delivery plan. Teams evaluating a recurring service can compare the managed performance testing FAQ.
What should performance testing services prove?
Start with an operational claim: checkout supports a defined arrival rate while 95 percent of successful requests complete within a target and errors stay below a limit; a nightly job finishes before a business cutoff; a queue catches up after an outage; or an API protects itself under overload. Name the workload, dataset, topology, software version, observation window and pass criteria. Without those conditions, a headline requests-per-second number is not reusable evidence.
Separate user experience from component timing. Browser rendering, network latency, API processing, database waits and asynchronous completion are different measures. For a web journey, combine protocol traffic that creates representative backend load with a smaller browser cohort that measures rendered interaction. Grafana's official website load-testing guidance explains protocol, browser and hybrid approaches and recommends thresholds appropriate to each.
Which test type answers which question?
| Test | Question | Typical shape | Do not infer |
|---|---|---|---|
| Smoke | Does the script and instrumentation work? | Very low load, short duration | Production capacity |
| Load | Does the target workload meet thresholds? | Expected mix for a representative period | Behavior beyond tested demand |
| Stress | Where does service degrade or fail? | Increasing pressure past expected range | A safe operating limit without recovery analysis |
| Spike | Can the service absorb a sudden change? | Rapid increase and decrease | Long-duration stability |
| Soak | Does behavior drift over time? | Sustained representative load | Maximum throughput |
| Capacity | What bounded demand can the architecture support? | Incremental load with resource and queue evidence | Future capacity after untested changes |
Use several tests in sequence. A smoke test validates scripts and telemetry. A baseline creates a quiet comparison. Load verifies the expected case. Stress finds the constraint. Soak exposes leaks, compaction, cache and scheduled-job interactions. Recovery shows whether queues drain and service returns to normal. Each run should have one primary question; a giant mixed scenario is difficult to diagnose and expensive to repeat.
How is a representative workload model built?
Use production telemetry, forecasts and business events to estimate arrivals, concurrency, journey mix, think time, request size, cache state, data distribution and background work. Distinguish open models, where work arrives independently, from closed models, where a fixed user pool waits for responses. The distinction matters: a closed test can reduce request arrivals as the system slows and make overload look better than it is.
Include authentication, reads, writes, searches, file operations and asynchronous polling in realistic proportions. Parameterize identities and records so caches and locks behave credibly. Preserve referential integrity and cleanup. Model hot keys and large accounts if production has them. Apache JMeter's best-practices guide explicitly warns that load-generator sizing and coordinated omission can produce inaccurate results; validate the generator as well as the target.
Why use percentiles and multiple thresholds?
Averages hide tails. Report p50 for typical behavior and p90, p95 or p99 where slower experiences matter, alongside error and throughput measures. Define which responses count as successful, because fast errors can improve latency. Use journey-specific thresholds: login, search and checkout may have different consequences. Grafana k6 thresholds are explicit pass/fail expressions over metrics, suitable for automation when grounded in a valid workload.
A threshold is not automatically an SLO. A service-level objective applies to real service behavior over a defined window; a test threshold is an acceptance criterion under controlled conditions. They should be related, but the test may be stricter to retain headroom. Record statistical uncertainty and test-to-test variance. A ten-second run with five samples cannot substantiate a p99 claim.
| Evidence | Example definition | Decision supported |
|---|---|---|
| Latency | p95 successful checkout completion below target at stated arrivals | User-experience acceptance |
| Errors | Failed or invalid outcomes divided by attempted work, by reason | Reliability under demand |
| Saturation | CPU, memory, pool, queue and storage utilization at each step | Constraint and headroom |
| Throughput | Completed business transactions per interval | Useful capacity, not request noise |
| Recovery | Time to return to normal latency and drain backlog after pressure | Operational resilience |
| Cost | Infrastructure and provider cost per completed transaction | Economic capacity |
What instrumentation is needed?
Correlate load-generator timestamps with service metrics, distributed traces, logs, database statistics, queue depth, provider limits and deployment events. Instrument business completion, not only HTTP status. OpenTelemetry's metrics guidance distinguishes counters, gauges and histograms and explains cardinality limits. Avoid user IDs and raw paths as metric attributes; excessive cardinality raises cost and can make important aggregates unreliable.
Synchronize clocks and preserve the test identifier in allowed telemetry attributes. Establish a quiet baseline, then compare one controlled change at a time. Trace samples should show where latency accumulates, but sampling can miss rare slow paths; pair traces with complete aggregate metrics. Capture configuration, autoscaling policy and database plan changes because an unexplained platform adjustment can invalidate comparison.
Must performance tests run in production?
Not always. A dedicated environment allows destructive stress and repeatability, but it must reproduce relevant topology, limits, data volume and providers. Production offers fidelity but creates customer and data risk. Low-rate synthetic monitoring, carefully bounded load and progressive experiments can be appropriate with approval, safeguards and immediate stop conditions. Never aim an uncontrolled test at a live service.
Before any high-load run, notify operators and vendors, verify observability, cap demand, protect dependent tenants, define abort thresholds and assign an incident commander. Exclude real financial or notification side effects through provider sandboxes or controlled test identities. After the run, confirm queues drained, autoscaling normalized and test data was removed. Accessibility and correctness still matter under load; a fast page that loses focus or omits content is not a successful result.
How are bottlenecks diagnosed?
A saturated resource is not automatically the root cause. High CPU may represent useful work, while a low CPU service may be blocked on a connection pool or downstream quota. Plot demand, completed work, latency, errors, queueing and resource saturation on the same timeline. Find the point where throughput stops increasing or latency changes slope. Then form a hypothesis and rerun after one measured change.
Look for concurrency limits, lock contention, connection pools, thread starvation, garbage collection, cache misses, query plans, storage latency, network limits and provider throttling. Google SRE's production service practices emphasize testing beyond rated capacity and graceful load shedding. A good service rejects excess work predictably, preserves priority traffic and recovers instead of collapsing into an unbounded queue.
How should performance testing services be priced and accepted?
Cost depends on journey count, protocols, workload research, data preparation, environment, generator scale, test duration, observability gaps, specialist analysis and retesting. Separate initial modeling and instrumentation from execution cycles. Cloud consumption, third-party test fees and engineering remediation should be visible assumptions. A fixed package based only on virtual-user count can ignore the work that makes results valid.
Accept the service through reusable assets and findings: workload model, scripts in source control, data procedure, environment manifest, thresholds, raw results, correlated dashboards, bottleneck analysis, capacity statement, safe-run procedure and handover. The capacity statement must include conditions and expiry triggers such as architecture, workload or provider change.
Example: testing a checkout capacity increase
Assume a campaign is forecast to double checkout arrivals. Use recent telemetry to model browse-to-cart-to-payment ratios, payment challenge rate, product hot spots and background fulfillment. Establish a quiet baseline, then run expected load with protocol clients and a small browser cohort. Increase arrivals in steps until the p95 checkout target, error limit or queue-age limit fails. Correlate each step with application, database, cache, queue and provider signals rather than stopping at the first red threshold.
If payment callbacks become the constraint, test a bounded worker increase and rerun the same model. Then hold expected load long enough to observe connection recycling, memory, scheduled jobs and queue stability. End by forcing the provider sandbox to delay callbacks and verify graceful customer messaging, backlog growth and catch-up. The capacity statement should name tested arrivals, journey mix, data, topology, software version, provider assumptions, headroom and the changes that require retesting.
Preserve the scripts, raw measurements and dashboard snapshot with the result. A later team should be able to reproduce the workload, identify which configuration changed and compare equivalent intervals. Without reproducibility, a performance report becomes a historical anecdote rather than engineering evidence.
Key takeaways
- Begin with a business workload and measurable outcome, not a virtual-user number.
- Use smoke, load, stress, spike, soak and recovery tests for different questions.
- Interpret percentiles with errors, throughput, saturation and sample size.
- Instrument the complete path and validate the load generator.
- State capacity only for the tested software, topology, data and workload conditions.
Frequently asked questions
How often should performance tests run?
Run small deterministic checks on relevant changes, scheduled representative tests for trend, and full capacity or soak work before material launches or architecture changes. Frequency should reflect risk and cost. Keep scripts current through routine execution rather than reviving them only before a deadline.
Is maximum requests per second a useful result?
Only with latency, error, completion, recovery and workload conditions. A system can accept more requests by queueing them indefinitely or returning errors. Useful capacity is completed business work while agreed quality thresholds hold and sufficient headroom remains.
Conclusion
Performance testing services are valuable when they turn demand into an evidence-backed operating boundary. Model real work, instrument the path, increase pressure deliberately and test recovery. The result should tell engineers what constrains the system and tell leaders what demand can be supported under named conditions.