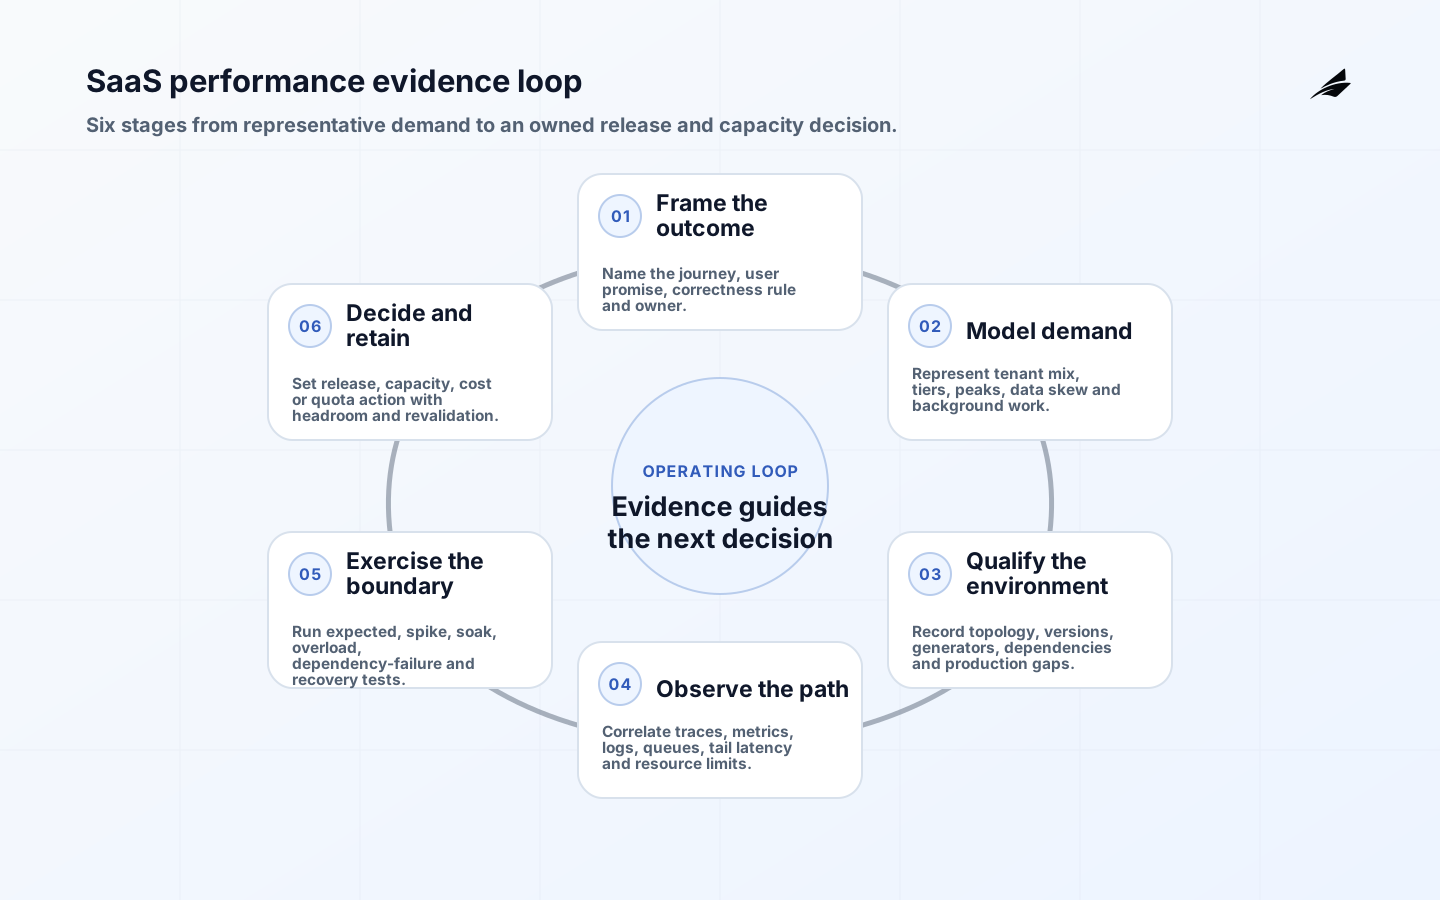
A performance testing plan for SaaS should answer a business question, not merely produce a throughput chart. Can representative customers complete the journeys that matter while tenants, background jobs and dependencies compete for shared resources? A useful plan sets that boundary, models demand honestly, measures tail behavior and preserves correctness under pressure. It also says what the environment can predict about production, where it cannot, and who owns the decision when evidence is incomplete. Use the SaaS performance readiness checklist, SaaS performance testing FAQ and managed SaaS performance checklist as companion planning material, while keeping this plan focused on scope, cost, risk and delivery evidence.
The k6 thresholds guidance treats thresholds as explicit pass-or-fail criteria, including error-rate and percentile-duration conditions. Google SRE connects capacity planning to demand forecasts and regular load testing, while the AWS SaaS Lens calls for tenant-aware testing because one tenant can consume resources that affect another. OpenTelemetry signals make the result diagnosable across traces, metrics, logs and context. These sources support a plan that ends in an owned release, remediation or capacity decision rather than a vanity number.
Turn the implementation plan into a decision contract
Start with the user journey and its consequence. Login, search, checkout, report generation, bulk import, webhook processing and administrator actions do not share the same urgency or failure meaning. For each journey, name the actor, expected volume, concurrency shape, latency percentile, acceptable error rate, freshness promise and business assertion. An asynchronous acknowledgement is not success if the record is never reconciled. A fast read is not success if it returns another tenant's data. Write the objective in language product, engineering, data and operations can all review before choosing a test tool.
| Journey | Performance question | Correctness assertion | Decision owner |
|---|---|---|---|
| Interactive read | Does the tail stay within the user-facing budget? | The response is current and tenant-authorized. | Product and service owner |
| Transactional write | Can accepted work complete without unbounded contention? | One request creates one intended business effect. | Domain and data owner |
| Bulk import | Can the queue drain in the promised window? | Accepted, rejected and retried rows reconcile. | Operations owner |
| Webhook | Can bursts and dependency failure be absorbed? | Signatures are verified and events are deduplicated. | Integration owner |
| Reporting | Can expensive reads avoid starving routine traffic? | The result is complete for the requested tenant and period. | Data product owner |
Build a tenant-aware workload model
A realistic SaaS load testing strategy represents a distribution of customers rather than copies of one average account. Include small steady tenants, large tenants with deep history, bursty API consumers, report-heavy accounts, onboarding cohorts and tenants that generate background work. Preserve tenant identity in fixtures and result dimensions so fleet percentiles do not hide harm to a particular cohort. Add think time, session renewal, pagination, cache warm-up, retries and request dependencies. A script that repeats an isolated GET can create traffic while missing the locks, queues, fan-out and data skew that make a shared SaaS service difficult to operate.

The AWS SaaS Lens performance guidance highlights cross-tenant impact, tenant-consumption, workflow, onboarding, throttling, data-distribution and isolation tests. Turn those categories into named scenarios. Use a bounded tenant cohort when testing aggressive behavior, tag results by tier and route, and make the test data large enough to exercise realistic query plans. Synthetic data should be safe to use, but it must still preserve cardinality, skew and state transitions that influence capacity.
| Workload dimension | Representative variation | Evidence to inspect |
|---|---|---|
| Tenant size | Small, medium and large record populations | Latency, database waits and resource use by cohort |
| Traffic shape | Steady, bursty, scheduled and event-driven demand | Queue age, admission behavior and recovery time |
| Feature mix | Reads, writes, imports, exports and reports | Route-level tail latency and downstream pressure |
| Tenant tier | Different quotas, plans and service promises | Fairness, throttling and protected capacity |
| State profile | Cold cache, warm cache, retries and stale jobs | Correctness, duplicate work and freshness |
Qualify the test environment and its limits
Document topology, region, data volume, service tiers, network path, feature flags, autoscaling limits, queues, caches and external-service substitutes before the first serious run. A smaller environment can establish comparative evidence, but its absolute capacity cannot be projected by simple multiplication when database, cache and queue behavior scale differently. Record the application build, infrastructure version, scenario commit and configuration with every result. The evidence pack should state which production characteristics are represented, which are approximated and which remain untested.
Control fixture creation and cleanup so one run does not inherit another run's backlog or cache state. Seed production-like cardinality and skew; a query plan that is fast with ten rows may fail when one tenant owns millions. Confirm the load generators have spare CPU, memory and network headroom, or they may become the bottleneck. Run a smoke test before scaling traffic, warm the system deliberately, and report cold-start findings separately from steady-state behavior.
Instrument the complete request and business path
A performance test is useful when the team can explain why a threshold failed. Correlate the client request with service traces, metrics, structured logs, queue age, database waits, connection pools, cache hit rate, garbage collection, CPU, memory and downstream limits. Tag by scenario, route, release and bounded tenant cohort; avoid uncontrolled high-cardinality labels such as raw user identifiers. OpenTelemetry defines traces, metrics, logs and baggage as complementary signals, so the operating question should be visible across the path rather than trapped in one dashboard.
Choose scenarios that answer different risk questions
Use a smoke run to prove scripts, credentials, fixtures and assertions. Use an expected-load run to test the named demand forecast. Use a stress run to locate the safe boundary, a spike run to expose admission and autoscaling delay, and a soak run to reveal leaks, backlog accumulation or slow degradation. Add dependency-failure and recovery exercises when the product promises continued service during partial outage. Do not label every run a load test; name the decision each scenario is intended to inform.
Keep correctness checks inside the workload. Assert tenant scope, authorization, idempotency, data freshness, status transitions and reconciliation, not just HTTP success. Inspect retry amplification: an SDK may preserve a green success rate while multiplying downstream work and user latency. Also watch for coordinated omission, where a client waits for a slow response and therefore sends less load at the exact moment the service is degraded. The test harness and the service telemetry must tell the same story.
Define release gates before execution
Write thresholds before the run and tie each one to a service objective or business promise. A gate might require a p95 and p99 latency limit for a named journey, an error-rate ceiling, a queue-age limit, a maximum retry ratio, zero cross-tenant correctness failures and a recovery window. Add a regression comparison where an absolute target is too generous. A failed threshold should trigger triage and a decision record, not repeated runs until noise produces a green result. If the target changes, record who changed it, why and what evidence must be collected again.
| Gate | Pass evidence | If it fails |
|---|---|---|
| User experience | Journey percentile and error rate meet the approved budget. | Find the slow path and assess release impact. |
| Business correctness | Assertions hold under concurrency, retries and delayed delivery. | Stop promotion and investigate data or state integrity. |
| Tenant fairness | No cohort loses its promise because another cohort is noisy. | Tune quotas, isolation, scheduling or architecture. |
| Capacity headroom | Safe operating range leaves room for failover and forecast error. | Add capacity, reduce demand or revise the launch plan. |
| Recovery | Backlog drains and objectives return after the exercise. | Improve back-pressure, rollback or operator runbooks. |
Run the plan as a repeatable delivery program
- Approve journeys, forecast ranges, tenant distributions, data profiles and thresholds with product and operations owners.
- Version scripts, fixtures, environment configuration and result schema together so a finding can be reproduced.
- Prove the generator, observability path and abort controls with a low-volume smoke run.
- Run expected-load and boundary scenarios while checking business assertions, tenant fairness and dependency behavior.
- Record saturation, recovery, cost signal and the tested safe operating range with unresolved assumptions.
- Convert findings into a release, capacity, architecture, quota or product-limit decision with an owner and review date.
Connect capacity evidence to cost and service limits
Capacity planning is not a single maximum requests-per-second number. State the safe range for a named workload, the first limiting resource, the headroom required for failover and maintenance, and the demand level that requires revalidation. Include the cost of load generation, test environments, observability retention, data seeding, engineering time and dependency usage. A cheaper test that cannot reproduce the production bottleneck is not cheaper evidence. Use cost and capacity together so the decision can distinguish optimization, scale-out, quota changes and a product promise that needs to be narrowed.
Autoscaling is a control loop, not a guarantee of instant protection. The Kubernetes Horizontal Pod Autoscaling documentation describes periodic metric evaluation, readiness considerations and stabilization behavior. Test scale-up delay, warm-up, scale-down safety, missing metrics and queue growth. If the queue is already beyond the user promise when new capacity arrives, admission control, prioritization or graceful degradation may matter more than adding replicas.
Review evidence and make the release decision
Run the result review with product, service, data, infrastructure and support owners. Present demand assumptions first, then correctness, user experience, saturation, recovery and cost. Show distributions and environment differences instead of presenting one throughput value as universal capacity. Assign every failed gate and unexplained anomaly. If a limitation is accepted, document the affected cohort, mitigation, owner, expiry and revalidation trigger. If the evidence is not representative, call the result directional and plan the missing test rather than upgrading uncertainty into approval.
Key takeaways
- Begin with journeys, business effects and service promises, not a generic throughput target.
- Represent tenant size, tier, data skew and background work so shared-resource harm is visible.
- Qualify the environment and record what it can and cannot predict about production.
- Define percentile, correctness, queue, fairness, headroom and recovery gates before execution.
- Correlate load results with traces, metrics, logs, queues and dependency signals to explain failures.
- Make the output a named release, capacity, cost or product decision with a revalidation date.
Frequently asked questions
What should a SaaS performance implementation plan prove?
It should prove that named journeys complete correctly within agreed limits under a representative workload, identify the first limiting resource and show how the service recovers. The final record should state whether to release, remediate, add capacity, adjust a quota or narrow the promise.
How is multi-tenant performance testing different from ordinary load testing?
It keeps tenant identity, tier and behavior in both fixtures and results. That lets the team detect noisy-neighbor effects, uneven quotas, tenant-specific data skew, isolation failures and a protected service promise that fleet averages conceal.
Should a release gate use averages or percentiles?
Use percentiles for tail experience and pair them with error rate, business correctness, queue age and saturation. An average is useful context, but it cannot show how many users encounter the slowest or most harmful outcomes.
When should capacity evidence be repeated?
Repeat it after material changes to demand shape, tenant mix, data cardinality, architecture, service tier, dependency behavior or autoscaling. Repeat it before an event is expected to exceed the tested safe range, and after a production incident changes the operating assumptions.
Conclusion
A strong performance testing for SaaS implementation plan turns uncertainty into a controlled decision. It names the journeys and promises, models the tenants who create the demand, qualifies the environment, instruments the full path and tests both overload and recovery. With thresholds set in advance and evidence retained, product and engineering leaders can explain not only whether the service passed, but what it can safely support, what it will cost and which action is required next.