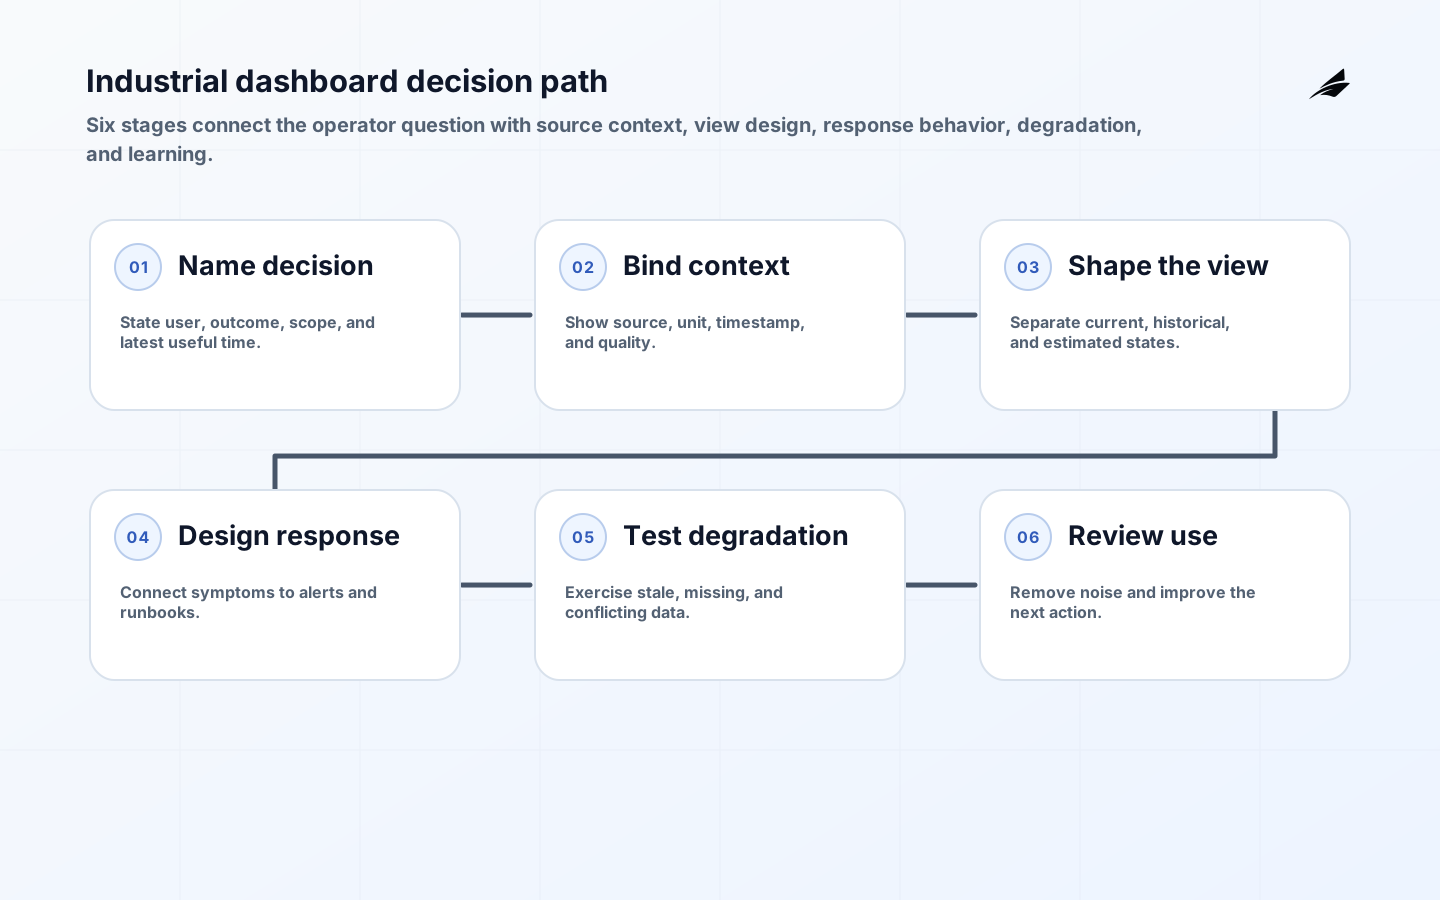
Industrial dashboards earn trust when they help an operator decide what to do next with current, qualified context. A growing connected operation does not need more panels by default; it needs a small set of views whose meaning, freshness, and ownership remain clear under pressure.
Define the industrial dashboards decision
Write the industrial dashboard decision so another operator can challenge it: name the trigger, accountable owner, authoritative inputs, permitted action, and evidence of completion. Separate an observation from a command, a request from a confirmation, and a convenience view from the record of truth. Mark stale, estimated, duplicate, and unavailable inputs explicitly, then show how each state changes the next action. The NIST SP 800-82 Rev. 3 provides a useful organizing lens; local procedures must convert that lens into named responsibility.
| Decision element | Question to settle | Evidence to retain |
|---|---|---|
| Outcome | What useful decision or bounded action is supported? | A named workflow and acceptance example |
| Authority | Which source, person, or policy is decisive? | Owner and source-of-truth record |
| Failure | What is the safe state when an input is unavailable? | Test result and recovery owner |
| Change | Who may alter rules, mappings, or access? | Reviewed change and rollback point |
Set boundaries before adding coverage — shift decisions and panel context
Map operators, process signals, historian context, alarms, work instructions, external services, temporary support access, configuration stores, and every route that can alter the outcome. Record source, destination, purpose, direction, identity, expected timing, and owner in the responsibility matrix. Treat hidden data age, quality, or source as an operational risk. The device capability baseline in NISTIR 8259A reinforces unique identification, configuration control, data protection, logical access, software update, and cybersecurity-state awareness. Where an asset lacks a capability, document the compensating control plainly.
- Name the business and technical owner for each consequential path.
- Record the normal state, degraded state, and recovery state.
- Keep identities and privileges proportionate to the action.
- Place age, quality, and time basis beside each value so a shift user can distinguish current evidence from an old observation.
- Give temporary exceptions an approver, expiry, and removal check.
- Test the boundary with realistic maintenance and outage conditions.
Make the operating path explainable — shift decisions and panel context
For industrial dashboards, show responsibility at every handoff, not only the movement of data. Follow one representative signal through validation, policy, storage, display or action, and later review. Keep event time separate from receipt and processing time; stable identifiers should let retries and manual reconciliation point to the same work. At a trust boundary, authenticate the caller, constrain its role, and record the decision without recording secrets. NIST SP 800-207 supports this context-aware approach; use a gateway or mediated service when equipment cannot enforce the control directly.
Design for failure and recovery — shift decisions and panel context
Industrial dashboard design earns credibility in its failure behavior. Plan for a missing dependency, delayed record, duplicate message, expired access, partial rollout, and human handoff. Show uncertainty and route each consequential decision to an authorized person. A retry is only one mechanism: recovery also needs bounded timing, stable identifiers, and proof of whether an earlier attempt succeeded. Keep the exception queue investigable, name the evidence and resolver in the runbook, and exercise it in a representative environment rather than a clean lab.
| Condition | Expected behavior | Operator check |
|---|---|---|
| Delayed or stale input | Preserve the value with its age and limit actions needing freshness | Confirm the state is visible, not silently substituted |
| Policy or identity failure | Deny the sensitive action and record the reason | Use a time-limited exception only through the approved path |
| Partial service loss | Continue only the bounded work that remains safe | Verify queue, local state, and recovery owner |
| Unexpected result | Contain the affected path before broad changes | Compare the operational record with retained evidence |
Measure signals that change a decision — shift decisions and panel context
Start with stale panels, acknowledged alarms without work, and recurring manual exports. Give every measure an owner, threshold, and response habit. Pair leading signals such as overdue credential rotation or growing backlog with outcomes such as failed recovery drills and support time. Review routine cases as well as incidents, preserve the screen specification and source-to-widget mapping, and sample transactions to expose undocumented paths, stale inventory, or workarounds that aggregate metrics conceal.
Roll out in bounded, reversible steps — shift decisions and panel context
An industrial dashboard rollout should include the people who operate the affected workflow. Choose a cohort with understood consequences and meaningful variation, establish a baseline, validate the normal path, inject one uncomfortable condition, and review the result with its support owner. Keep configuration, policy, and interface changes traceable and reversible. Weigh service impact, safety, evidence quality, and support readiness together; a technically successful view is incomplete if a technician cannot identify asset state or a supervisor cannot find the next owner. Fold the lesson into the procedure and retest after material device, site, or dependency changes.
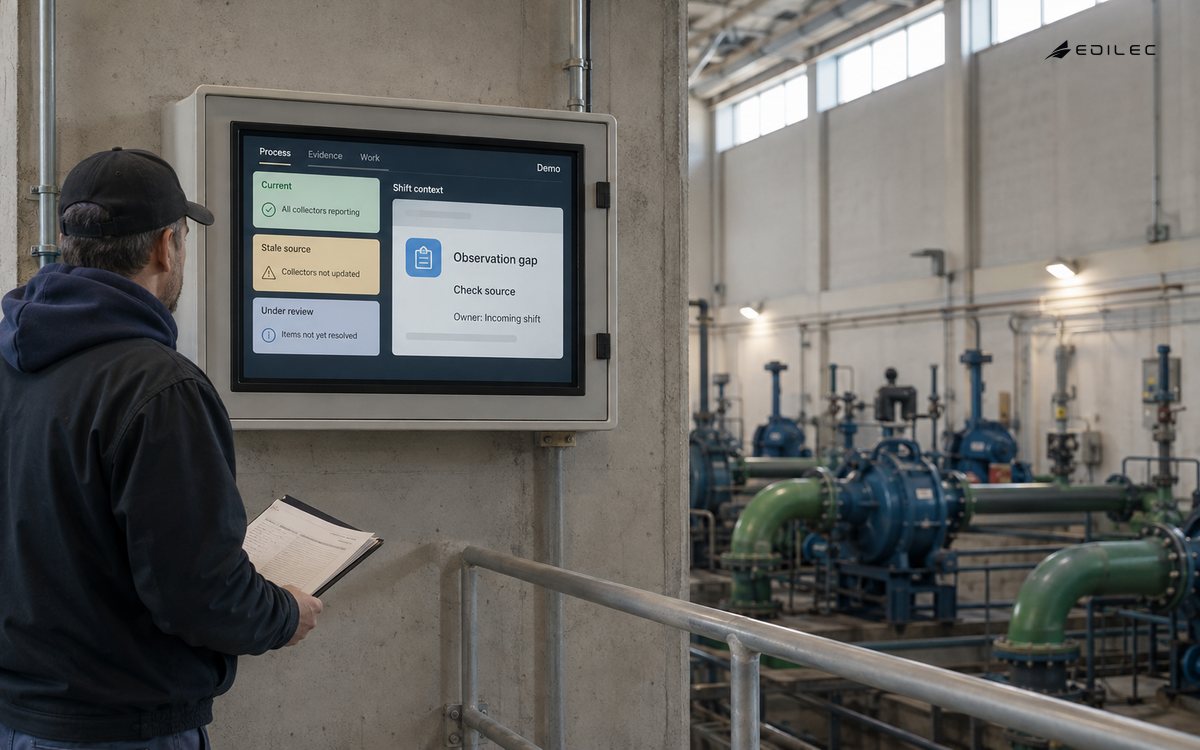
For a dashboard, test the screen during a shift handover rather than only in a design review. Ask the incoming operator to identify what has changed, which values are stale, which alarms require action, and where the supporting context lives. Watch for labels that imply causation when they only show correlation. A useful dashboard reduces the time to a sound decision; it does not force people to open five systems or memorize color conventions. Keep the operational question beside the measure so later changes do not turn a trusted view into decoration.
Turn dashboard panels into operator decisions
Industrial dashboards should answer a sequence of operating questions instead of displaying every available tag. For each panel, record the user, decision, time horizon, source, freshness expectation, and safe next action. A supervisor deciding whether to pause a line needs current state, recent trend, confidence, and alert rationale; an engineering review may need longer history and calibration context. Keep those views distinct, label current, delayed, stale, unavailable, estimated, and under-review states, and use RFC 3339 for unambiguous timestamps. The view earns trust when the operator can explain both the value and the evidence behind the action.
For industrial dashboard decisions, compare Industrial Dashboards for Connected Systems: A Practical Guide, Industrial Dashboards in Production: Make the Screen Earn Trust, Industrial Dashboards Checklist for Reliable Digital Operations; together they frame operator dashboard, ownership, and recovery without asking the reader to infer the operating boundary.
- Define the decision, user, source, time horizon, and freshness for every key panel.
- Show stale, estimated, unavailable, and under-review states explicitly.
- Trace each metric to a source, transformation, aggregation, and owner.
- Test alerts and drill-downs with operators using adverse cases.
Industrial dashboards for growing teams takeaways for operators
- Industrial dashboards begins with a specific operational decision, not a technology purchase.
- Make authority, time, quality, identity, and recovery visible at every handoff.
- Use a documented boundary to reduce accidental paths and unclear ownership.
- Test degraded operation before a broad rollout relies on it.
- Measure signals that cause a named review or action.
- Retain enough context for a later reviewer to reconstruct why the dashboard showed that result and what action followed.
A dashboard also needs a deliberate relationship with the work queue behind it. For each high-consequence panel, identify the record that can be opened, the action that is permitted, and the evidence that closes the action. If a line appears healthy because its collector stopped sending data, the screen should expose the observation gap rather than inherit a green state from the last sample. If an alarm is acknowledged without a completed response, keep the unresolved condition visible and show who owns the next check. Test the view at shift change by asking an incoming operator to explain the latest change without help from the person who configured the panel. Then repeat the exercise with stale timestamps, a missing asset, a duplicated alert, and a changed threshold. The useful result is not a more attractive layout; it is a shorter path from a qualified signal to a safe, attributable decision.
Keep a small panel ledger beside the dashboard configuration. It should name the source query, calculation owner, refresh expectation, suppression rule, and last review date for each consequential view. When a historian, collector, or identity service changes, the ledger tells the team which panels need a comparison before the next shift. Archive the old definition with the change record so a later incident review can distinguish a real process change from a changed calculation.
Industrial-dashboard questions for a working shift
What should an industrial dashboard show first? Show the decision, affected asset or process, latest useful time, source, unit, quality state, and the next authorized action before adding more charts. How should stale or missing data appear? Use an explicit state with age and source context; never let a stale value look current or let a missing reading look like a safe condition. When should a dashboard rollout expand? After operators can use one bounded workflow under normal and degraded conditions, explain the evidence, and complete the associated response or recovery action.
Primary references for A Field Guide to Industrial Dashboards for Growing Teams
The primary references for this operating decision are NIST SP 800-82 Rev. 3, NIST SP 800-137, OpenTelemetry Metrics Data Model, Prometheus Alerting Best Practices. Apply them with site procedures and sector requirements when checking the implementation.
Conclusion: keep operator dashboard explainable
A dependable industrial dashboard makes the next authorized action obvious under pressure. Begin with the workflow that carries real consequence, label normal and degraded states, and retain the evidence needed for later review. Related guidance on Industrial Dashboards for Connected Systems: A Practical Guide, Industrial Dashboards in Production: Make the Screen Earn Trust, and Industrial Dashboards Checklist for Reliable Digital Operations can extend the operating pattern.