Industrial Dashboards for Connected Systems: A Practical Guide is not a shopping-list exercise. Industrial dashboards has to help product teams make a safer, faster operating decision while preserving the evidence needed when conditions change. The practical question is showing operators what requires attention, the evidence behind it, and the route to a responsible action. A plant manager seeing a red availability tile needs to know whether it reflects planned downtime, a late signal, a gateway outage, or an actual line stop before dispatching anyone. A useful design therefore starts with the real task, the people allowed to change it, and the consequence of being wrong; technology follows from that model. For this part of the system, name the accountable owner, supporting evidence, exception route, and next measurable check.
Build an industrial dashboard around decisions
Begin by drawing the normal path and the uncomfortable path. State what enters the system, what decision is made, where authority lives, what may be automated, and how a person notices an exception. For industrial dashboards, vague boundaries create expensive ambiguity: a team can build a technically successful connection or control and still be unable to explain who owns it during an incident. Give each boundary an owner and a review cadence. Keep production behavior separate from experimentation, and make the intended failure mode visible to the people who carry the operational consequence. Within this design choice, name the accountable owner, supporting evidence, exception route, and next measurable check.
| Viewer question | Useful display | Avoid |
|---|---|---|
| What needs action now? | prioritized exception with owner and age | a wall of unranked alarms |
| Can I trust this value? | source, freshness, and quality status | a precise number without context |
| What changed? | comparison period and event trail | a color change with no explanation |
The table is a starting point, not an architecture diagram. It forces the team to name defaults instead of treating permissive access, implicit freshness, or informal escalation as normal. Interview an operator, an engineer, and the support owner with the same scenario. If their answers differ, resolve the policy before adding integrations. practical companion and implementation companion can help frame the surrounding design work, but the local system record must remain the authority for the decision at hand. When implementing this design choice, name the accountable owner, supporting evidence, exception route, and next measurable check.
Set industrial dashboards architecture and data contracts
For delivery teams working on industrial dashboards, this information boundary should connect search intent, canonical URLs, rendered content, structured metadata, crawl paths, and measurable search outcomes to evidence an accountable owner can inspect. Architecture should preserve meaning as well as move bits. Define the identifiers, timestamps, status or quality values, version fields, and source-of-truth rules that a downstream user needs to interpret an outcome. Do not collapse an unknown value into zero, a delayed observation into real time, or a local acknowledgement into a completed business action. Those shortcuts make a demo appear clean while making investigation impossible. A narrow, tested contract with explicit limits is more useful than a broad interface that quietly changes behavior at each site. In this operating review, move beyond the information boundary only after the owner can show the accepted result, the exception path, and the signal for another review.
| Metric choice | Definition needed | Review check |
|---|---|---|
| Availability | planned-state treatment and observation window | reconcile against shift records |
| Throughput | count point, unit, and rejected items | inspect representative source events |
| Energy intensity | production denominator and meter scope | flag missing meter intervals |
In industrial dashboards, delivery teams should make the relationship between search intent, canonical URLs, rendered content, structured metadata, crawl paths, and measurable search outcomes explicit and reviewable. Apply least privilege at the data and action boundary. A service that reads a status should not receive a command capability; a reporting user should not inherit engineering access. Record policy and mapping versions alongside the result so a later review can distinguish a changed process from a changed interpretation. This is particularly important when a supplier, managed service, or legacy workstation participates in the path. The system needs an accountable interface even when the underlying equipment cannot provide modern controls itself. This operating review should close the information boundary only when the result, unresolved exception, and next review condition are recorded.
Deliver industrial dashboards in controlled increments
A dependable industrial dashboards design makes search intent, canonical URLs, rendered content, structured metadata, crawl paths, and measurable search outcomes visible to the owner responsible for this operating decision. Choose one site, device class, or workflow where the benefit can be measured and a rollback is practical. Capture representative normal cases plus late data, failed dependencies, replacement hardware, and a scheduled maintenance window. Establish a baseline before the release: response time, manual work, false alerts, missing records, or reachability failures. Release tooling and runbooks with the capability, not after it. A pilot that succeeds only because its original builder watches every event has not demonstrated an operable design. The next step in this operating review is justified when the team can trace the accepted outcome, the fallback route, and the owner of follow-up.
- 1. Name the user, decision, cadence, and escalation route for every screen.
- 2. Show time range, freshness, units, and calculation status beside critical measures.
- 3. Retain the source event or historian point behind a drill-down.
- 4. Separate an alarm state from a derived performance indicator.
- 5. Test the dashboard with a normal shift, an outage, and a late-arriving correction.
A field example for industrial dashboards
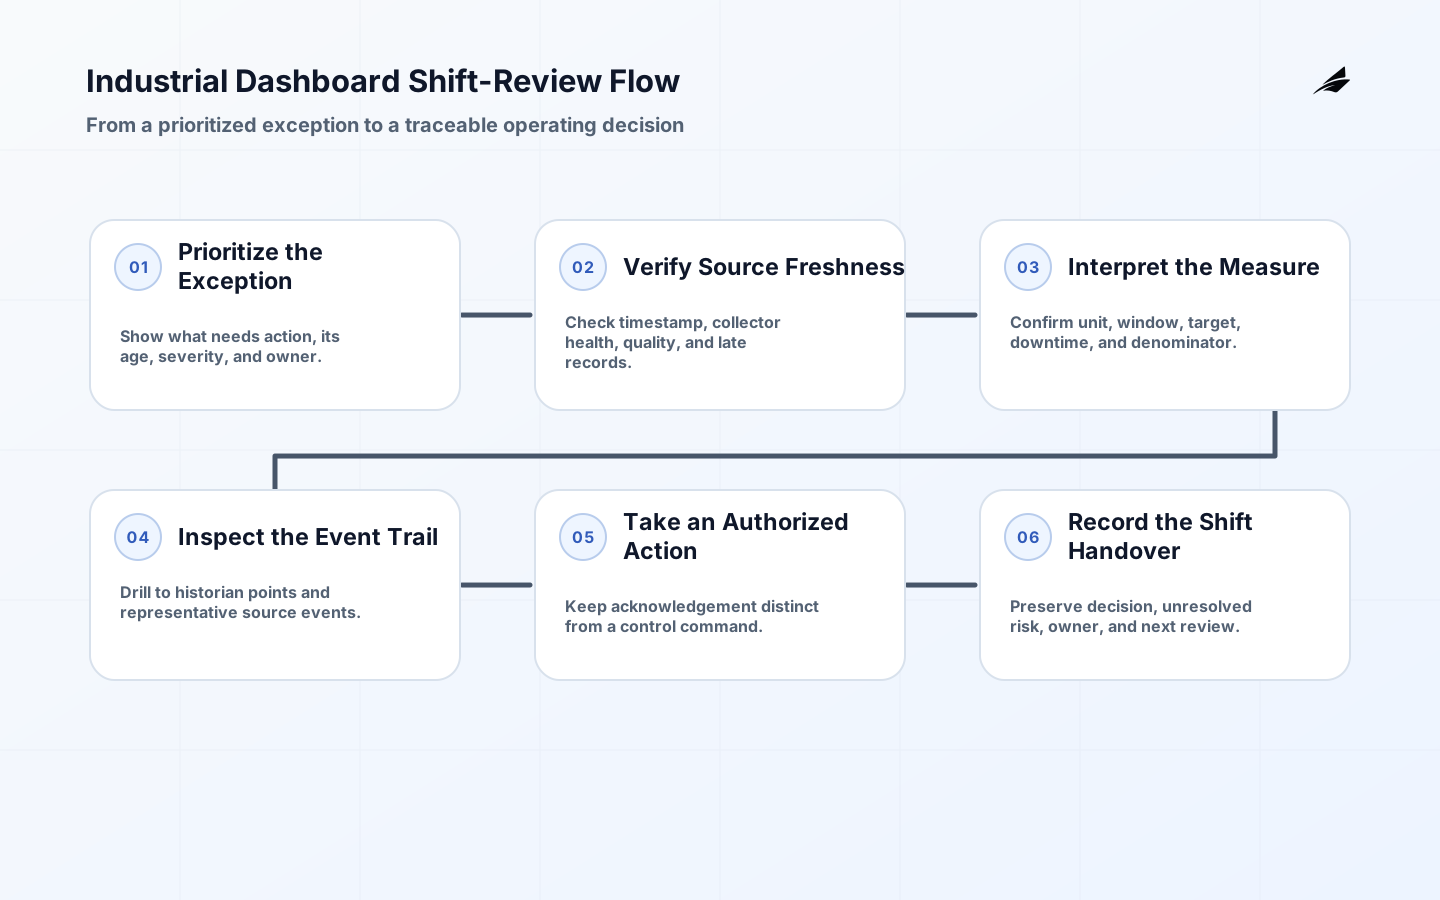
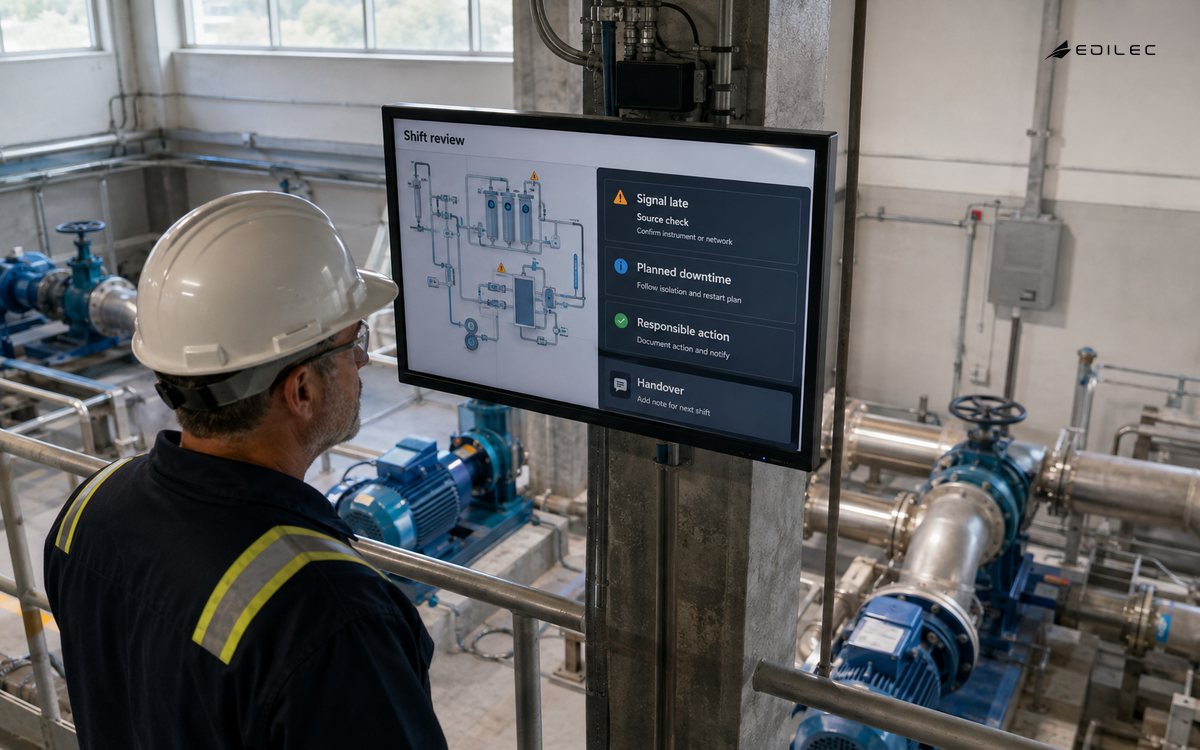
A practical shift review is a useful acceptance test. Ask the operator to identify the next action from the screen, then ask a supervisor to explain why the measure changed and a data owner to trace its source. If each person needs a different hidden spreadsheet, the dashboard has not established a dependable operating view. Keep the raw event trail available for investigation, but do not turn the first screen into a historian browser. The dashboard earns attention by making the decision and its limits obvious. Record who accepted each metric definition and revisit that agreement when equipment, shift practice, or data collection changes.
Secure and recover industrial dashboards
This recovery path for industrial dashboards is strongest when search intent, canonical URLs, rendered content, structured metadata, crawl paths, and measurable search outcomes can be reviewed as one operating record. Security controls need to be exercised as operating controls. Verify the identity or authorization decision, the logged evidence, the alert path, and the recovery action together. Test a revoked credential, an unavailable dependency, an unexpected input, and an attempted action from the wrong zone or role. For high-consequence environments, involve the process owner before testing anything that could affect availability. The aim is not perfect prevention; it is a bounded, observable response that preserves service and gives responders facts rather than guesses. Acceptance in this operating review requires a visible outcome, a bounded exception path, and a measurable reason to revisit the decision.
Operate industrial dashboards with evidence
Delivery teams can keep industrial dashboards accountable by recording how search intent, canonical URLs, rendered content, structured metadata, crawl paths, and measurable search outcomes shape this information boundary. After launch, review whether the capability changed work in the intended way. Track the signal that prompted the investment and the operational costs created by the solution: investigation time, exceptions, rework, stale data, denied actions, support load, and change lead time. Pair quantitative trends with a small sample of real cases. A lower alert count can mean better filtering, but it can also mean a broken collector; a faster workflow can mean sound automation or an unsafe bypass. The record of decisions and exceptions is what makes the metric interpretable. For this operating review, the responsible owner should be able to explain what passed, what remains exceptional, and which signal reopens review.
For industrial dashboards, the evidence behind this information boundary should cover search intent, canonical URLs, rendered content, structured metadata, crawl paths, and measurable search outcomes. The guidance here is grounded in NIST SP 800-137, NIST SP 800-61 Rev. 2, NIST SP 800-82 Rev. 3, CISA Industrial Control Systems Cybersecurity. These references describe industrial-system boundaries, zero-trust decisions, monitoring or lifecycle controls, and protocol-specific behavior; they do not replace a site-specific hazard review, vendor documentation, or contractual obligations. Use the primary documentation for the actual versions and equipment in scope, especially before authorizing a command path or changing a production configuration. Do not widen the scope from this operating review until the evidence supports the result, the recovery route, and the next operating check.
Industrial dashboards takeaways
- Start with the operating decision, consequence, and accountable owner.
- Make time, quality, identity, and version state visible rather than implied.
- Grant the minimum access required for the specific read or action.
- Pilot against real exceptions and prove recovery before broad rollout.
- Measure the benefit alongside false positives, rework, and support cost.
- Use every incident or dispute to refine the contract and runbook.
Industrial dashboards FAQ
What is the first practical step?
Pick one repeatable operational decision and write its current path, owner, inputs, failure modes, and proof of completion. That compact inventory exposes whether industrial dashboards is a real need or a vague proxy for another problem. When explaining this part of the system, name the accountable owner, supporting evidence, exception route, and next measurable check.
Should a team buy a platform or build a capability?
The team responsible for industrial dashboards should examine search intent, canonical URLs, rendered content, structured metadata, crawl paths, and measurable search outcomes together before accepting this operating decision. Compare the ownership model, integration boundary, exportable evidence, recovery behavior, and lifecycle cost before feature lists. A product can accelerate commodity functions, but the team still owns the operational contract and the decision to grant access or automate action. For this design choice, test one expected case, one ambiguous case, and one failure with a documented recovery action. A reviewer using this operating review should be able to reconstruct the decision, route an exception, and identify the next trigger without relying on private context.
How should success be measured?
A reviewable industrial dashboards workflow ties this operating signal to search intent, canonical URLs, rendered content, structured metadata, crawl paths, and measurable search outcomes. Measure the original decision outcome and the control health together. For example, improve time to diagnose a site outage while also watching data completeness, unactioned alerts, failed authorization, and manual bypasses. A single adoption number cannot establish trust. Within this part of the system, test one expected case, one ambiguous case, and one failure with a documented recovery action. Completion in this operating review means the accepted state, correction route, and future review signal are all visible to the operating team.
Conclusion: make industrial dashboards accountable
Good industrial dashboards makes the intended path easier to run and the unexpected path easier to understand. Keep the scope close to a real operating decision, make the authority and data contract explicit, and prove recovery under realistic conditions. That combination gives teams a capability they can extend with confidence instead of another opaque dependency that works only when nothing unusual happens. When implementing this part of the system, test one expected case, one ambiguous case, and one failure with a documented recovery action.