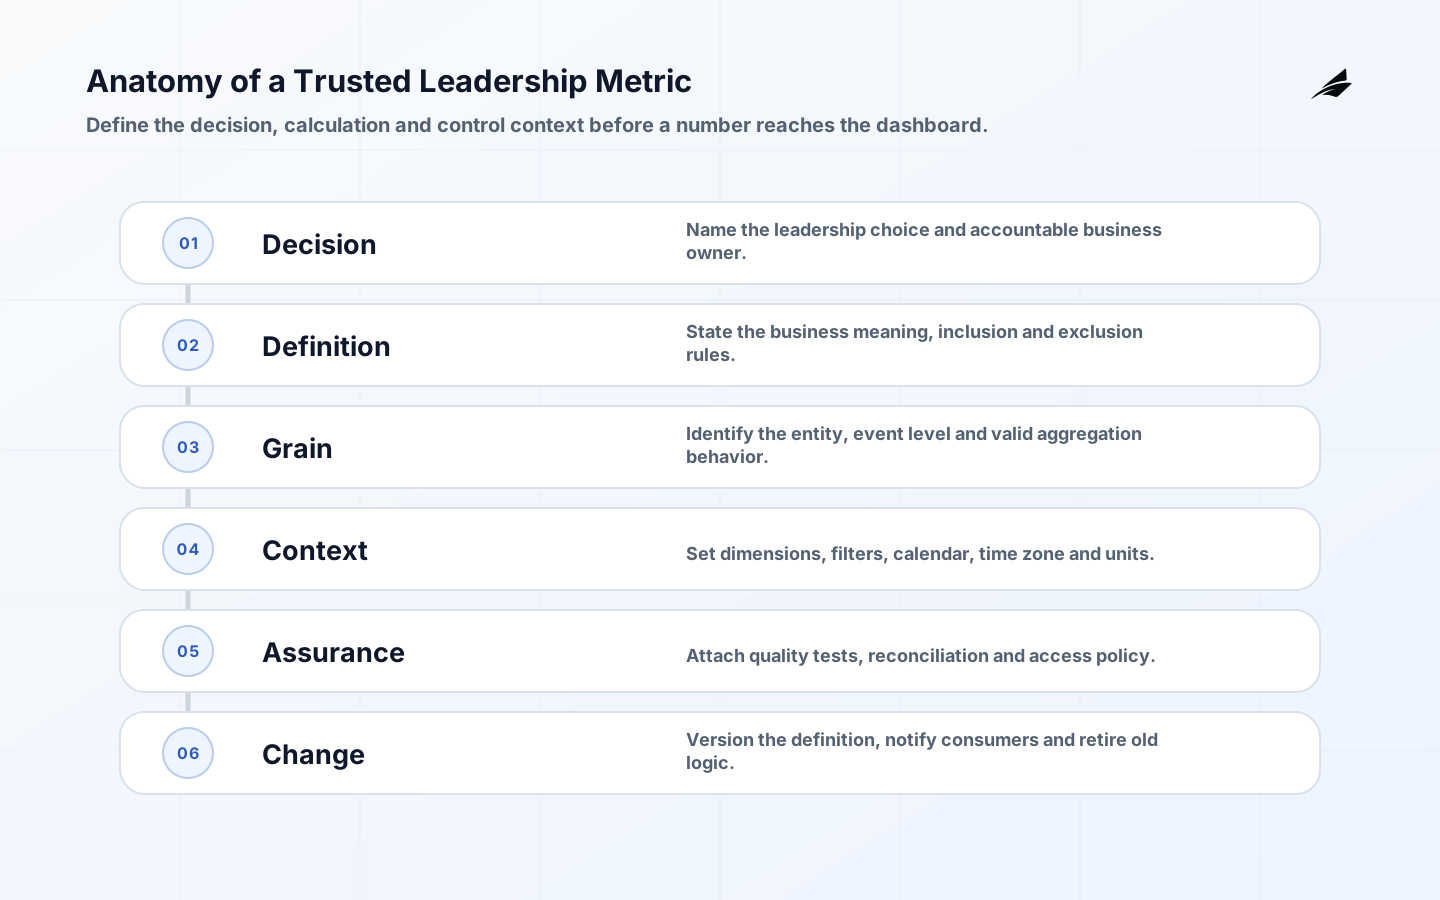
A leadership dashboard earns trust when every number has a stable meaning, an accountable owner and enough context to support a decision. A metric layer provides that contract between business language and analytical data. It defines measures, dimensions, entities, relationships, filters and access rules in a reusable model so reports do not independently reinvent revenue, active customers or service performance.
What a metric layer must accomplish
The layer should make a calculation executable, discoverable, testable and reusable. A written KPI dictionary helps humans, but it does not stop two dashboards from running different SQL. A governed semantic model can centralize the expression, permitted dimensions, join path, time behavior and policy context used by downstream tools. LookML, Power BI semantic models, Tableau's logical layer, dbt's Semantic Layer and Cube implement this idea differently; the architecture should follow existing skills, consumers and control needs rather than a tool label.
Leadership dashboards also need narrative discipline. The metric layer can calculate correctly, but it cannot decide which question deserves executive attention. Each dashboard measure should link to a decision, owner, review cadence and response. A page filled with available data is a catalogue, not an operating instrument.
| Model element | Question it answers | Example |
|---|---|---|
| Entity | What business object is being measured? | Account, order, subscription or support case |
| Measure | What numeric observation is aggregated? | Recognized amount or resolved-case count |
| Dimension | How may the result be grouped? | Region, product, segment or reporting month |
| Metric | What governed business calculation is exposed? | Resolution rate with explicit numerator and denominator |
| Relationship | How can entities combine without changing grain? | Many orders belong to one account |
| Policy | Who may query which rows or fields? | Regional leaders see assigned territories |
Begin with leadership decisions, not existing charts
Interview decision makers about recurring choices: where to intervene, which forecast assumption changed, whether service quality is degrading, or which customer segment needs attention. Record the action threshold and the person empowered to respond. Then inspect the current reports and queries. Conflicts often reveal differences in time windows, status filters, currency treatment, late-arriving data or the grain at which records are joined.
- Name the decision and accountable business owner for every candidate metric.
- Write the business definition before the warehouse expression.
- State the entity, event grain, numerator, denominator, filters and time zone.
- Define whether corrections restate history or appear in the current period.
- List permitted dimensions and relationships, including many-to-many risks.
- Set freshness, completeness and reconciliation expectations with escalation owners.
Design a complete metric contract
A strong contract includes a stable identifier, display name, plain-language definition, owner, business purpose, source entities, calculation, valid dimensions, default time grain, freshness expectation, data-quality tests, sensitivity classification and change history. It should also provide examples at boundaries. For a resolution rate, specify reopened cases, merged cases, cases without a close timestamp and whether the denominator uses created or eligible cases.

Keep units and aggregation behavior explicit. Counts and sums may be additive across some dimensions; balances and distinct counts often are not. Ratios should usually be recomputed from governed components rather than averaged from row-level percentages. Currency metrics need conversion source, rate date and reporting currency. Time metrics need a calendar, time zone and period-closing rule. These details prevent mathematically valid but commercially misleading views.
Protect grain through the data model
Star schemas separate facts used for summarization from dimensions used for filtering and grouping. That shape remains useful because it makes grain visible. Semantic tools can model more complex relationships, but they cannot rescue an undefined grain. Joining account snapshots to orders and support cases can multiply rows if each side contains several records per account. The model must specify keys, cardinality and how measures behave across every allowed join path.
Consider a generic subscription business. Monthly recurring value may live at subscription-month grain, product usage at account-day grain and support tickets at case-event grain. A leadership view can place metrics from these domains together, but a single flattened table may duplicate value when usage or cases fan out. Separate facts, conformed account and calendar dimensions, and governed relationships preserve each measure's intended aggregation.
| Failure mode | Dashboard symptom | Control |
|---|---|---|
| Fan-out join | Totals rise when a new dimension is added | Declare grain and cardinality; test joined aggregates |
| Late data | Current period changes without explanation | Publish freshness and close status |
| Status drift | Teams count different lifecycle states | Use governed status mapping with an owner |
| History overwrite | Past segment results move unexpectedly | Choose snapshot or slowly changing dimension behavior |
| Local calculation | Two dashboards show different answers | Expose certified metrics and inventory duplicates |
| Broad access | Sensitive detail appears in drill-down | Apply and test row and field policies upstream |
Govern metrics like production code
Store model definitions in version control where the platform allows it. A proposed change should include the business reason, affected dashboards and consumers, test evidence, owner approval, effective date and migration plan. Automated checks can validate syntax, source availability, uniqueness, relationship assumptions, null behavior and comparison with known fixtures. Human review is still needed for meaning.
Use deprecation rather than silent replacement. If leadership changes the definition of an active account, publish the new version, explain whether history will be restated, compare old and new results, migrate consumers and remove the old metric after an announced window. The dashboard should surface material breaks or incomplete periods instead of smoothing them away.
Roll out from one decision domain
Choose a domain with visible disagreement and an engaged owner, such as service operations or sales pipeline. Inventory queries and dashboards, agree two or three high-value definitions, model the supporting entities and dimensions, and reconcile outputs against source records. Pilot with analysts and decision makers before certifying the metric for wider use.
- Frame: choose the decisions, owners and existing reports in scope.
- Discover: trace source fields, transformations, joins, corrections and access constraints.
- Model: define entities, dimensions, measures, metrics and relationships in code or governed configuration.
- Test: use fixed examples, reconciliations, freshness checks and role-based access tests.
- Pilot: compare old and new outputs and observe whether leaders can explain differences.
- Adopt: certify dashboards, document changes, monitor usage and retire duplicate calculations.
Design the dashboard around interpretation
Show the current value, comparison period, target or decision threshold, freshness state and a concise explanation of material movement. Provide drill paths to governed dimensions, not unrestricted detail. Distinguish provisional from closed periods. When data is incomplete, show that state clearly. A blank, stale or qualified value is more trustworthy than a precise number whose limitations are hidden.
Measure the layer itself through adoption and reliability: percentage of priority dashboard metrics served by governed definitions, duplicate calculations retired, failed model tests, freshness breaches, unresolved definition disputes and time to approve a change. Query latency and warehouse consumption matter too, but caching should not obscure freshness or access rules.
Risks to manage
The largest risks are centralizing ambiguity, giving one team a permanent bottleneck, coupling every consumer to one vendor, and treating technical certification as business agreement. Reduce them with domain ownership, clear contribution workflows, portable definitions where practical, consumer contracts and a small architecture council for cross-domain relationships. Keep raw and exploratory access available to qualified analysts while labeling governed outputs distinctly.
Validate metrics before leadership relies on them
Validation begins with small, inspectable examples. Create fixtures that cover ordinary records and difficult boundaries: duplicate events, missing keys, reopened cases, late corrections, status changes and periods crossing time zones. Compute the expected answer with the business owner, then test the model against it. These examples become regression tests when source schemas or definitions change. They are especially valuable for ratios and distinct counts whose errors can remain hidden in plausible totals.
Reconciliation compares the governed metric with authoritative operational or financial records at an agreed level and period. Differences need categories rather than manual balancing: timing, scope, mapping, data quality or implementation. Set a tolerance only where the business meaning supports one, and publish unresolved material differences. Reconciliation should be repeatable; a spreadsheet adjustment known to one analyst is not a production control.
Observe production use as another form of testing. Record query failures, forbidden dimension combinations, freshness misses, unusual result shifts and consumers still using local calculations. Provide a clear route for users to question a number, and preserve the metric version and filters involved. A dispute is useful evidence about documentation, model behavior or business alignment when it can be investigated from reproducible context.
Assign an incident path for materially wrong metrics. The owner should be able to label affected dashboards, pause distribution, identify the first bad period, correct the model or source, rerun tests and communicate whether prior decisions need review. Analytical errors rarely require the same response as service outages, but leadership numbers deserve controlled correction rather than an unexplained refresh.
- Test fixed examples at the metric's natural grain and at supported rollups.
- Reconcile to an authoritative record with documented timing and scope.
- Run access tests using real roles and representative row policies.
- Compare material definition versions before changing certified dashboards.
- Monitor freshness, query errors, anomalies and unresolved disputes after release.
Key takeaways
- Start from recurring leadership decisions and accountable owners.
- Define grain, timing, filters, units and relationship behavior for every metric.
- Use a reusable semantic model to execute definitions consistently across consumers.
- Review, test, version and deprecate metric changes through an explicit workflow.
- Expose freshness and uncertainty so dashboard precision never outruns data quality.
Frequently asked questions
Is a KPI dictionary enough?
It is useful documentation but cannot enforce calculations. Pair it with executable definitions, governed relationships, tests and ownership. Generate or link documentation from the implemented model where possible so prose and behavior do not drift.
Should the metric layer live in the warehouse or BI tool?
It depends on consumers and architecture. A BI-native layer may be simplest for one platform; an independent layer can serve several tools and applications. Evaluate versioning, access control, query semantics, portability, latency, cost and who will operate it.
Who approves a metric change?
The business owner approves meaning, the data owner verifies sources and quality, and the model maintainer verifies implementation and consumer impact. High-impact cross-domain metrics may need a finance, risk or executive data forum.
Will a metric layer fix a poorly designed dashboard?
No. It can make the numbers consistent and governed, but leaders still need a focused hierarchy, relevant comparisons, visible freshness and an agreed response. Presentation and operating cadence remain product-design work.
Conclusion
A leadership metric layer is a living business contract implemented in data. It succeeds when definitions survive reuse, changes are explainable, relationships preserve grain and leaders know what action each number supports. Build it a domain at a time, prove it against real records, and govern it with the same care as any shared production interface.