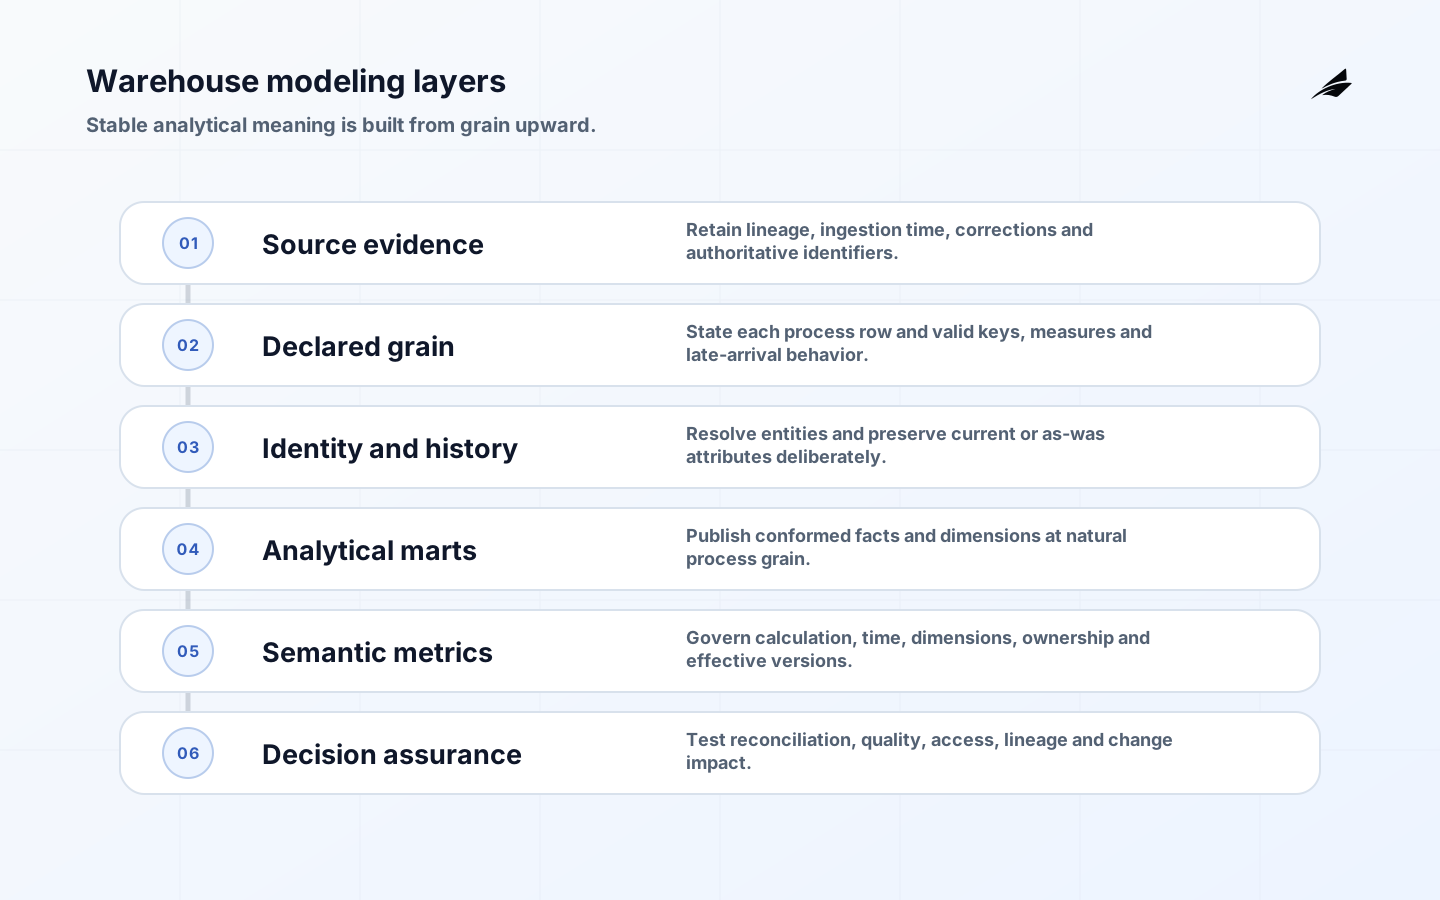
Warehouse modeling for data analytics turns operational records into stable business questions. The model must state what each row represents, how entities are identified, which history is preserved and which measures can be combined. This guide is for data leaders and engineers choosing a practical architecture that supports trustworthy dashboards, analysis and downstream products without coupling every consumer to source-system quirks.
It complements Edilec's CTO guide to data pipelines, semantic layer planning guide and dbt models guide. The central discipline is to model business processes and decisions before optimizing tables for a specific visualization.
Key takeaways
- Declare fact-table grain in plain language before adding measures or joins.
- Use conformed dimensions to compare processes, but preserve process-specific facts at their natural grain.
- Choose history behavior per attribute and record effective timing explicitly.
- Keep metric definitions governed above reusable warehouse models rather than duplicating dashboard formulas.
- Test keys, relationships, freshness, accepted values and business invariants as production controls.
Start from decisions and business processes
Inventory recurring decisions, not reports. For each decision, record actor, measure, dimensions, time interpretation, latency, comparison and consequence. Then identify business processes that create analyzable events: order line, shipment movement, invoice line, support case transition or daily account balance. Stable processes make better model boundaries than source applications, which change through migration and acquisition.
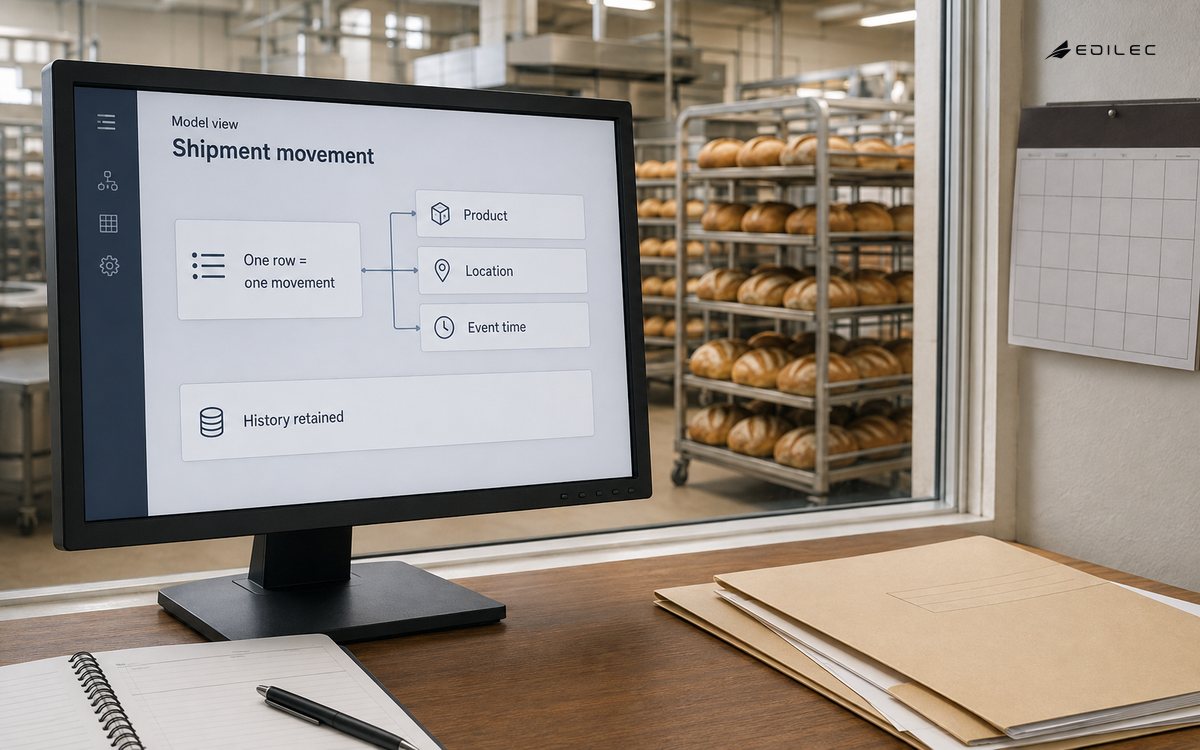
Create a bus matrix mapping processes to shared dimensions such as customer, product, location, employee and date. Resolve vocabulary and ownership early. A customer may mean bill-to party, ship-to location, account hierarchy or individual; collapsing these meanings creates plausible but wrong analysis. Document source precedence and unresolved identity.
| Model decision | Question | Evidence |
|---|---|---|
| Grain | What exactly does one fact row represent? | Written declaration and uniqueness test |
| Keys | How is the entity stable across sources and time? | Mapping rule, unmatched rate and stewardship |
| History | Which attributes need as-was and current views? | Effective dates and example queries |
| Measures | Can values be summed across each dimension? | Additivity classification and tests |
| Latency | How current and complete must the process be? | Freshness objective and late-arrival policy |
Declare grain before facts and dimensions
The grain is a binding contract. “One row per order” is insufficient if orders contain lines, partial shipments, discounts and returns. State “one row per source order line version” or “one row per shipment event” and define whether deleted or corrected records create new rows. Every measure and foreign key must be valid at that grain.
Do not join facts directly merely because they share an identifier. Sales, targets and inventory often have different grains. Use conformed dimensions or an explicit bridge and aggregate before joining. Microsoft guidance on many-to-many relationships recommends star-schema patterns instead of direct many-to-many fact relationships because direct joins limit filtering and can mask integrity issues.
Use facts and dimensions deliberately
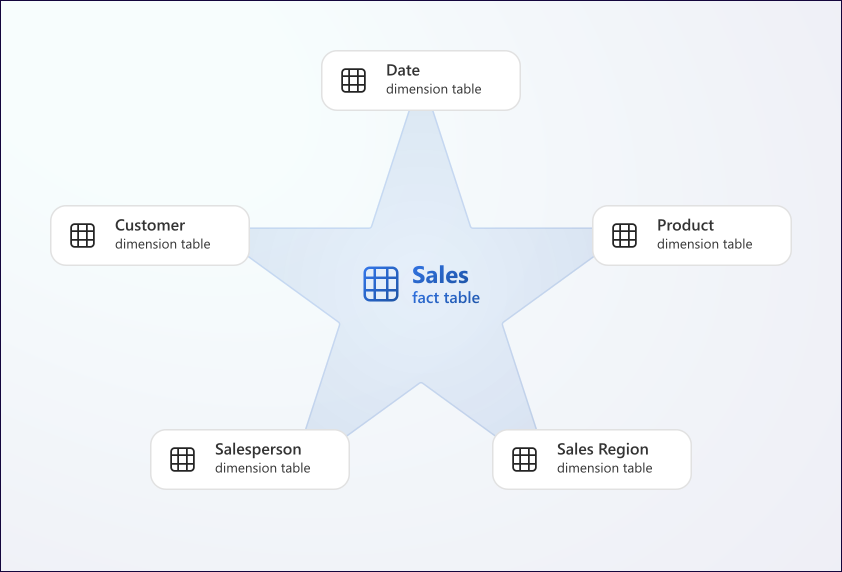
Fact tables record measurable process observations and dimension keys. Dimensions describe the entities used to filter, group and interpret those facts. The Microsoft star schema guidance explains that dimensions support filtering and grouping while facts support summarization. Keep descriptive attributes out of large facts unless performance evidence justifies a controlled denormalization.
Classify measures as additive, semi-additive or non-additive. Revenue may sum across time and product; account balance usually does not sum across time; ratios should be recomputed from components. Store base measures at fact grain and define reusable calculations above them. Include transaction, periodic snapshot and accumulating snapshot patterns only where each answers a clear lifecycle question.
Manage identity and history
Use warehouse surrogate keys when source identifiers can collide, change or be reused. Retain the source key and system for lineage. Define an unknown member so early-arriving facts remain loadable without null foreign keys, then resolve them later. Monitor unresolved keys and assign stewardship; a technical placeholder must not become permanent silent ambiguity.
Choose slowly changing behavior per attribute. Overwrite corrections and attributes where only current state matters. Create effective-dated dimension versions when analysts need the value as known at event time. Preserve both current and historical mappings where organizational hierarchy changes affect comparisons. Specify inclusive and exclusive time boundaries and handle late corrections deterministically.
| Pattern | Use when | Watch for |
|---|---|---|
| Transaction fact | Each event or line matters | Corrections, duplicates and event ordering |
| Periodic snapshot | State is compared at regular intervals | Missing periods and non-additive balances |
| Accumulating snapshot | Milestones of one lifecycle are tracked | Reopened processes and updated timestamps |
| Type 1 dimension | Only corrected or current value matters | Loss of historical reporting meaning |
| Type 2 dimension | As-was analysis is required | Overlapping effective windows and row growth |
| Bridge | Legitimate many-to-many membership exists | Double counting and weighting rules |
Separate source, transformation and consumption layers
Retain source-shaped staging data with ingestion metadata, then build standardized intermediate models and business-facing marts. This layering isolates extraction changes, makes transformations testable and limits consumer exposure to raw complexity. Use incremental processing only with a defined change key, lookback and reconciliation strategy. A fast incremental model that misses late updates is incorrect.
Partition and cluster according to measured query patterns. The BigQuery performance overview is one provider example of reducing scanned data and understanding query plans. Optimize after correctness and workload observation. Avoid multiplying near-identical marts to solve one slow dashboard; that creates definition drift and higher maintenance.
Create a governed semantic contract
Warehouse models should expose clean dimensions and base measures; a semantic layer can define metrics, entities, time grains and allowed dimensions once. dbt semantic models are one implementation approach. Whichever tool is used, assign metric owners, version breaking changes and provide worked examples for filters, exclusions and time behavior.
Do not hide unresolved business disagreement behind code. Define gross and net revenue, active customer, on-time shipment and conversion with finance and operational owners. Preserve numerator and denominator for ratios. Add effective dates when policy changes, and keep historical dashboards reproducible where required.
Test and operate the model
Test uniqueness at declared grain, not-null required keys, referential integrity, accepted values, freshness, volume, reconciliation and business invariants. dbt data tests illustrate assertions over models and resources. Add custom tests such as non-overlapping history windows, balanced accounting components or shipment milestone order.
Monitor source arrival, transformation duration, failed tests, unresolved keys, late data, schema changes and consumer queries. Route each alert to an owner and document safe backfill. Use lineage to assess change impact. Review model usage and retire abandoned columns and marts with communication; indefinite compatibility makes every model harder to improve.
Implementation sequence
- Select one valuable business process and document decisions, grain and owners.
- Profile source keys, history, corrections, latency and data rights.
- Design facts, dimensions, conformance and late-arrival behavior.
- Build staging, intermediate and mart layers with reconciliation and tests.
- Define semantic metrics and validate them with representative business cases.
- Release to a limited consumer group, observe queries and establish change governance.
Evolve warehouse models without breaking trust
Classify changes as additive, behavioral or breaking. New nullable attributes may be additive; changed metric filters, grain, key behavior or history are behavioral even if schemas still compile. Publish impact, owner, effective date and migration path. Use lineage and query logs to identify consumers, but confirm critical uses with domain owners because not every export or downstream model is visible.
Run old and new models in parallel for a representative period and reconcile by important dimensions. Explain expected differences and investigate unexpected ones. For a grain change, create a new model or version rather than silently altering row meaning. For metric changes, preserve historical definitions or clearly restate prior periods according to approved policy.
Deprecate with dates and observable adoption. Provide replacement queries and office hours for material changes, then remove obsolete models after consumers migrate. Keeping every field forever increases ambiguity and compute cost. A governed retirement process makes the warehouse easier to understand while preserving evidence required for financial, regulatory or contractual reporting.
Security and privacy should shape the model. Classify sensitive attributes, minimize them in broad marts and enforce access at stable domain boundaries. Tokenize or aggregate where detailed identity is not needed. Test row and column policies with representative roles, and control extracts because a governed warehouse can still leak through downloaded files.
Document lineage for important metrics from source event through transformation and semantic definition. Lineage should identify code and ownership, but also business assumptions such as cancellation treatment or fiscal calendar. During an incident, this allows teams to distinguish delayed source data, transformation defects and changed metric policy.
Capacity planning should include concurrency, backfills and downstream extracts, not only daily load volume. Isolate or schedule heavy recomputation so it does not starve time-sensitive models. Measure cost per domain or workload and review inefficient queries with consumers before applying physical optimizations that complicate the logical model.
Frequently asked questions
Should every warehouse use a star schema?
No single pattern should cover every layer. Source-aligned or historized integration patterns can be valuable upstream, while star schemas often suit analytical consumption. Choose by change rate, audit needs, team skill and query behavior. Make boundaries explicit so consumers do not join raw integration structures casually.
When is one big table acceptable?
It can serve a narrow, stable use case when grain and duplication are controlled. It becomes risky when many processes, mixed grains and changing dimensions are flattened together. Preserve canonical models beneath any denormalized serving table and test reconciliation.
How do you know the warehouse needs remodeling?
Warning signs include repeated metric disputes, many-to-many joins, duplicated transformation logic, unexplained totals, slow change impact analysis and source fields exposed directly to executives. Use lineage and query logs to target the smallest model change that restores a clear contract.
Conclusion
Warehouse modeling for data analytics is contract design expressed in data structures. Declare grain, separate facts from dimensions, preserve required history, govern semantic metrics and test business invariants. A well-modeled warehouse lets teams change sources and tools while keeping important decisions explainable.