Executive Dashboards for Data Analytics: a Practical Guide
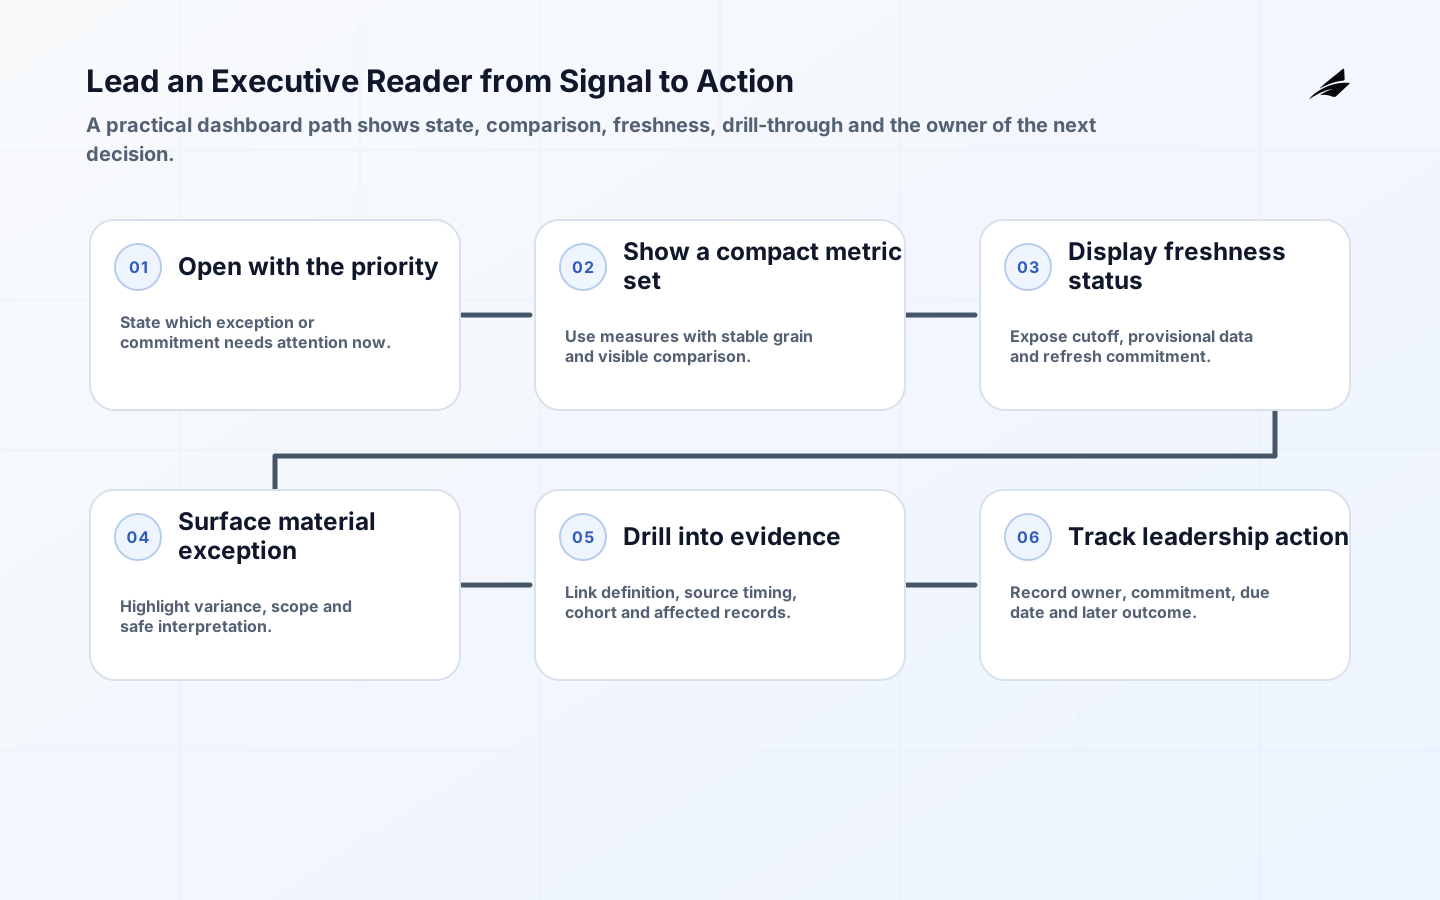
Executive dashboards becomes valuable when it helps IT managers decide which exception, investment, or operating commitment needs leadership attention now. Treat it as an operating product rather than a report-shaped by-product. The first design question is not which tool to buy; it is what a reader should be able to do differently when the leadership dashboard changes. Put that action, the person responsible for it, and the reporting cut-off in writing. This gives a team a practical way to judge whether the work is improving a decision or merely generating another view of the same uncertainty.
Set the executive dashboards decision boundary
Begin with a small set of decision metrics with clear drill-through and refresh expectations. A useful boundary names the action, the population included, the time basis, the acceptable delay, and the consequence of being wrong. It also distinguishes a preliminary signal from a settled answer. That distinction matters because people will otherwise apply a number beyond the conditions in which it was produced. The W3C PROV overview is a helpful conceptual reference: an output is easier to trust when the entities, activities, and responsible agents behind it can be explained.

For executive dashboards, the accountable producer is the accountable data product behind each metric. The consumer should not need to infer this from code or a meeting transcript. Record which fields are material, who may change the rule, and what constitutes a correction. This is also where teams should state the uncomfortable cases early: a metric definition dispute, a silent filter, a stale refresh, or a visualization that hides material uncertainty. A narrow, explicit contract makes those cases observable and gives delivery teams permission to decline requests that would blur the meaning of the result.
| Boundary element | What to specify | Reader benefit |
|---|---|---|
| Decision | which exception, investment, or operating commitment needs leadership attention now | A reader knows why the output exists. |
| Unit | a small set of decision metrics with clear drill-through and refresh expectations | Comparisons keep a consistent grain. |
| Owner | IT managers decision owner and data steward | Questions have a route to resolution. |
| Cut-off | Refresh commitment and correction policy | Provisional results are not mistaken for final ones. |
Design a executive dashboards contract
A contract is more than a schema. It joins business meaning to delivery behavior: required fields, permitted values, identity or key rules, time semantics, access, and evidence of a successful run. Make the contract small enough to review with the people who use it. Where transformations are involved, dbt data tests illustrate the value of expressing testable assertions close to the model. The precise tool is secondary; the durable habit is to turn a critical assumption into a check that can fail visibly. For a margin view, state the currency basis, close status, comparison period, and the drill-through available to a finance partner. A metric tile without these boundaries invites confident interpretation of a number that may still be provisional.
- Give every critical leadership dashboard a named owner and a backup contact.
- State the grain, key, refresh expectation, and inclusion rule in reader language.
- Version changes that alter historical comparison or decision meaning.
- Make exception status visible instead of silently substituting an estimate.
- Limit access and retention to what the stated decision genuinely requires.
Build the executive dashboards operating path
Build the first path around a real review or workflow, not a generic platform roadmap. Start with a representative record and walk it from creation to the leadership dashboard a reader sees. Identify where meaning is assigned, where records can arrive late, who can override a result, and how that override is retained. The implementation should expose its own limits: a delayed input, failed check, or unapproved adjustment must be legible before it affects an important decision. This is how a team prevents a technical success from becoming an operational surprise.
Instrumentation should capture enough context to investigate a surprising result without collecting every available attribute. OpenTelemetry semantic conventions are a useful reminder that shared names and defined meaning make signals easier to correlate across systems. Apply the same restraint here. Record identifiers, timestamps, version, source, and outcome where they explain the work; avoid uncontrolled labels and sensitive detail that neither support the decision nor improve accountability. Instrument the reading path rather than every hover: record whether the dashboard was opened for the scheduled review, which exception was explored, and whether a linked action was created. Reader behavior then informs design without becoming surveillance.
| Operating step | Control | Evidence to retain |
|---|---|---|
| Create or ingest | Validate identity, required values, and timing | Source timestamp and contract version |
| Transform or aggregate | Test material rules and reconcile key totals | Run identifier, test result, and owner |
| Publish or act | Show freshness and exception state | Version, reader context, and approval |
| Correct or replay | Preserve the reason and impact of the change | Exception record and downstream notice |
Control executive dashboards risk and access
The relevant control is the one that changes behavior when it fails. For executive dashboards, design for a metric definition dispute, a silent filter, a stale refresh, or a visualization that hides material uncertainty. Separate the authority to change a definition or rule from the authority to approve its use in a consequential decision. Restrict access to raw records and sensitive attributes, keep an audit trail for material changes, and test the response path rather than assuming an alert is enough. The NIST Cybersecurity Framework 2.0 is useful background for treating governance, protection, detection, response, and recovery as connected work rather than a final security review.
Measure executive dashboards as an operating capability
Measure whether the practice supports decisions, not just whether a pipeline ran. Useful operating signals include freshness compliance, unresolved metric disputes, reader actions taken, and the time required to answer a follow-up question. Review them with the person who takes the action and the person who owns the data path. A green technical dashboard does not prove that a business reader can interpret the output, while a single material exception can reveal that a supposedly mature process lacks a clear escalation route. Pair service measures with a small sample of real decisions and ask what evidence changed the outcome.
Use a review cadence that matches the decision. Daily work needs rapid visibility and a contained repair; monthly planning needs stable definitions and a clear restatement policy. The aim is not perfect data in every context. It is an explicit, defensible level of assurance for the decision at hand. For adjacent planning work, data quality checks and data pipeline planning show how a narrow contract can connect delivery detail to a usable management routine. At the end of a review cycle, remove one chart that produced no action and strengthen one definition that caused a question. This keeps the dashboard a decision surface instead of an accumulating archive of executive curiosities.
Apply executive dashboards in a real operating scenario
An operations leader reviewing service capacity might see demand, available slots, and a forecasted breach. The dashboard should state the data refresh time, show the cohort behind the breach, and link to the owner of the capacity plan. A stale forecast is then a visible condition to resolve, not a silent number that sends a team in the wrong direction.
Key executive dashboards takeaways
- Start with the decision which exception, investment, or operating commitment needs leadership attention now.
- Define a small set of decision metrics with clear drill-through and refresh expectations before selecting technology or charts.
- Make the accountable data product behind each metric accountable for a reviewable contract.
- Expose exceptions caused by a metric definition dispute, a silent filter, a stale refresh, or a visualization that hides material uncertainty before they influence action.
- Review freshness compliance, unresolved metric disputes, reader actions taken, and the time required to answer a follow-up question with the people who use and maintain the output.
Executive dashboards FAQ
What is the smallest useful first release? One decision, one defined leadership dashboard, one accountable owner, and an exception path that a reader can understand. Who should own it? The decision owner owns usefulness, while a data or platform steward owns the contract and delivery evidence; neither role can substitute for the other. When should the team expand scope? Only after the initial boundary has survived real use, corrections, and review. Expansion should preserve the meaning of the first result rather than importing loosely related measures because they are available.
Conclusion: make executive dashboards actionable
Effective executive dashboards gives IT managers a result they can interrogate, not simply consume. Define the decision, make the boundary and ownership visible, and keep evidence close to the action. That discipline produces a more durable leadership dashboard than a broad dashboard or data program with unclear limits. Teams that need to connect this work to planning can also use leadership metric design to turn definitions into repeatable review decisions.