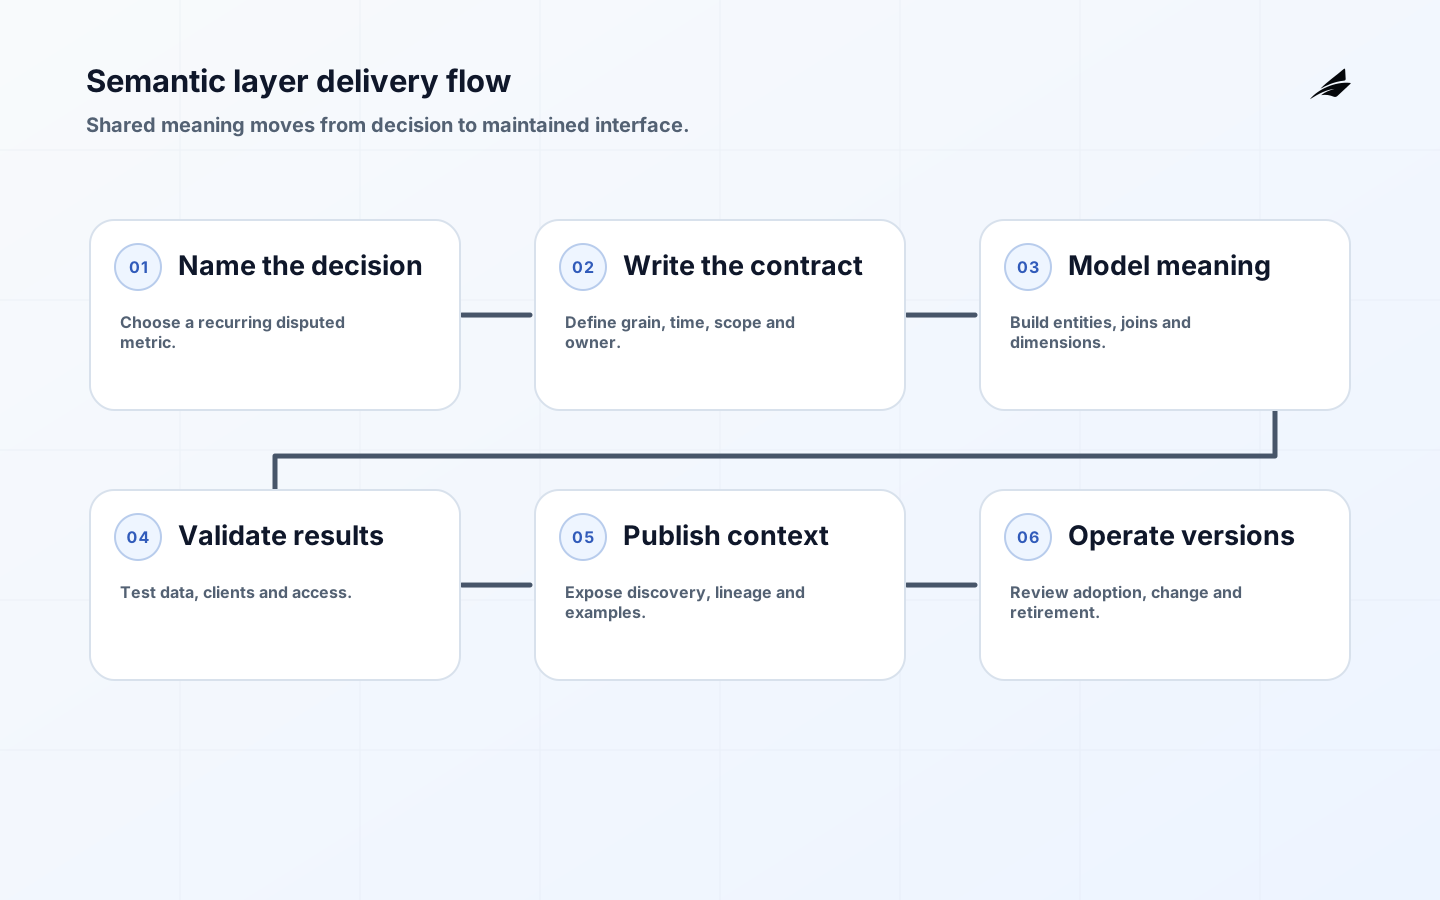
Semantic layers give analytics consumers a governed interface to business meaning: entities, dimensions, measures, metrics, relationships and access rules. Their purpose is not to hide every warehouse detail or eliminate exploratory analysis. A useful semantic layer makes a consequential metric consistent across supported tools, preserves the context needed to interpret it and gives owners a controlled way to test and change the definition.
This hands-on guide starts from a disputed or duplicated decision rather than a platform purchase. Teams planning shared calculations can compare the metric layers guide, while the warehouse modeling guide covers upstream structure. The dashboard adoption guide helps decide which metrics deserve a maintained product.
1. Choose the first semantic-layer decision
Select a recurring decision where teams currently reproduce a metric and disagree about population, time, scope or filters. Examples include active customers, fulfilled orders, gross retention or service backlog. Name the decision owner, consumers, cadence, actions and consequence of error. Gather the calculations currently used and explain why they differ. A metric with no owner or decision is a poor first candidate even if it appears on many dashboards.
Write a metric contract in reader language: entity and grain, eligible population, formula, time basis, exclusions, allowed dimensions, source, freshness, owner and expected failure behavior. Distinguish event time from processing time and current attributes from historical attributes. Mark whether a result is final, provisional or estimated. A semantic interface should not make unsupported slices look valid merely because a query can be generated.
| Contract element | Question | Example evidence |
|---|---|---|
| Entity and grain | What does one row or count represent? | One fulfilled order line |
| Population | Which records qualify or are excluded? | Cancelled and test orders excluded |
| Time | Which timestamp and timezone govern? | Fulfillment time in UTC |
| Dimensions | Which groupings preserve meaning? | Region as of fulfillment |
| Freshness | When should the result be available? | Hourly with visible cutoff |
| Owner | Who approves meaning and change? | Revenue operations steward |
2. Model entities, relationships and time
Build the smallest model that answers the chosen decision. Define primary entities and stable keys, then join relationships with explicit cardinality. Test one-to-many and many-to-many paths for fan-out. Measures should have a declared aggregation behavior; balances and ratios cannot always be summed across time or dimensions. Reuse dimensions only when their meaning and history are compatible across entities.

Treat time as a first-class design problem. An order can have created, paid, shipped and cancelled timestamps, each answering a different question. Customer segment may mean current segment or segment at the event date. Fiscal calendars, daylight saving time and late-arriving data need tests. Publish supported time grains and comparison behavior. Do not let a tool silently choose a timestamp because it is the first date column available.
3. Implement one vertical slice
Implement the contract against governed warehouse models, then expose it through one supported consumer. The current dbt Semantic Layer documentation describes centrally defined metrics that can be queried in downstream tools. Other implementations may use a BI model, API or query service. Evaluate semantics, access, caching, latency, versioning and tool coverage rather than assuming the product name defines the operating contract.
Keep definitions, tests and review in version control. Separate descriptive metadata from executable logic, but link them so a user can inspect both. Provide examples for normal and awkward filters. Instrument query failures and unsupported combinations. The interface should return an understandable error when a relationship, dimension or grain is invalid, not generate a plausible number. Preserve generated queries or equivalent execution evidence for diagnosis according to privacy needs.
4. Validate meaning, data and access
Create a fixture with known records for inclusions, exclusions, duplicates, nulls, late arrivals, refunds and relationship fan-out. Reconcile the semantic result with an independently reviewed reference calculation. Ask the decision owner to explain the result and intended action. Then compare supported BI, notebook and application clients for consistent filters, timezone and null behavior. A successful SQL compilation does not prove business correctness.
Test permissions at the semantic boundary and underlying warehouse. A metric may be broadly visible while customer identifiers or sensitive dimensions are restricted. Validate that aggregate queries cannot be manipulated to reveal small groups and that caches do not cross roles or tenants. Make denied dimensions and masked detail explicit in the user experience. Record access policy alongside the metric owner rather than relying on undocumented tool settings.
| Test family | Failure to catch | Acceptance |
|---|---|---|
| Grain | Duplicate facts after a join | Known entities count once |
| Time | Wrong event date or timezone | Boundary periods reconcile |
| Filter | Exclusion changes population unexpectedly | Contract examples match |
| Dimension | Invalid slice or slowly changing value | Supported history is preserved |
| Access | Restricted detail leaks through query or cache | Role tests deny or aggregate correctly |
| Client | Tools interpret null or filters differently | Supported consumers return equivalent results |
5. Publish discovery and lineage
Make the metric findable by business name, description, owner, status, source, dimensions, examples, freshness and change history. W3C DCAT 3 provides a vocabulary for interoperable data catalogs, distributions, services, versions and dataset series. A company catalog need not implement DCAT, but the standard is a useful reminder that discovery, access service and version are different concepts.
Lineage should connect the metric to models, jobs, sources and responsible processes. The W3C PROV family models entities, activities and agents involved in producing something. The OpenLineage object model represents jobs, runs and datasets with extensible facets. Use automated lineage as evidence, then add the business context automation cannot infer: why the metric exists, what exclusions mean and who may approve change.
6. Operate versions, performance and adoption
Set service expectations for freshness, availability and query latency by use case. Instrument the semantic service and upstream path; OpenTelemetry signals can correlate traces, metrics and logs where implementations support them. Show stale or degraded state to consumers. Caching must preserve user, role, filter, version and data-cutoff semantics. A faster response is not acceptable if it silently serves a different population.
Version material definition changes. Publish the difference, affected consumers, comparison impact, migration route and retirement date. Keep a prior version only for a bounded transition or a legitimate historical contract. Review usage by decision and client, query failures, disputes, performance and local reimplementations. Page views do not prove adoption; a metric is adopted when it repeatedly supports the intended decision without reconciliation outside the interface.
Create a contribution path for new metrics and dimensions. Require a decision, owner, contract, tests, access review and operating impact. Resist centralizing every exploratory calculation. Analysts need room to test hypotheses with clearly labeled local logic. Promote a calculation when it recurs, crosses teams or carries enough consequence to justify stewardship. Retire unused definitions with redirects and history so old dashboards do not become a second truth.
7. Migrate existing metrics without breaking trust
Inventory high-use local calculations and compare each with the candidate governed definition. Classify differences as defects, legitimate decision variants or historical contracts. Run both calculations over representative periods and explain every material variance by population, time, join or filter. Do not label one result certified until the owner and consumers can account for the difference and know which prior reports remain comparable.
Publish a migration guide with old and new names, definition changes, affected dashboards, query examples, effective date and retirement plan. Update downstream assets in owned waves and monitor for continued use of the local calculation. Preserve an explicit variant when the decision genuinely differs, giving it a distinct name and owner. Forcing unlike decisions into one metric creates consistency in code while obscuring meaning.
Plan rollback at the interface level. A semantic release may be reverted, but caches, extracts and published reports can preserve the changed result. Tag outputs with metric and data versions where consequence warrants it, invalidate incompatible caches and communicate the affected time window. A clear incident state protects trust better than silently switching definitions while users are reconciling numbers.
Keep an ownership map for shared dimensions and relationships as well as headline metrics. A metric steward cannot safely approve a definition when the customer, account or product model changes elsewhere. Route those upstream changes through impact analysis and require evidence from representative dependent metrics before release.
Review orphaned dimensions and relationships quarterly. Removing unused semantic paths reduces ambiguous joins, access surface and test cost.
Key takeaways
- Begin with a disputed recurring decision and an accountable business owner.
- Define entity, grain, population, time, dimensions, freshness and failure behavior.
- Test fan-out, history, awkward filters, access and client equivalence.
- Publish both executable lineage and the business context automation cannot infer.
- Version material changes and give consumers a bounded migration window.
- Measure adoption through supported decisions, disputes and local reimplementation, not traffic alone.
Semantic layers FAQ
Is a semantic layer the same as a data catalog? No. A semantic layer executes governed meaning; a catalog helps people discover and understand assets. They should link to each other.
Should every metric be centralized? No. Centralize recurring, shared or consequential definitions. Keep exploratory work flexible and clearly labeled until it merits sustained ownership.
Can the layer prevent all metric disagreement? It can make approved assumptions explicit and reusable. Legitimate decisions may still need different populations or time bases, which should be named rather than hidden.
Who owns a semantic metric? A business steward owns meaning and use; an analytics or platform owner implements and operates it. Both are needed for consequential definitions.
Conclusion: make shared meaning executable
Semantic layers become useful when they preserve the meaning that makes a metric actionable across tools and time. Start with one real decision, implement a narrow contract, test data and permissions, publish lineage, and operate versions from evidence. Scale governed meaning only as quickly as the organization can keep it trustworthy.