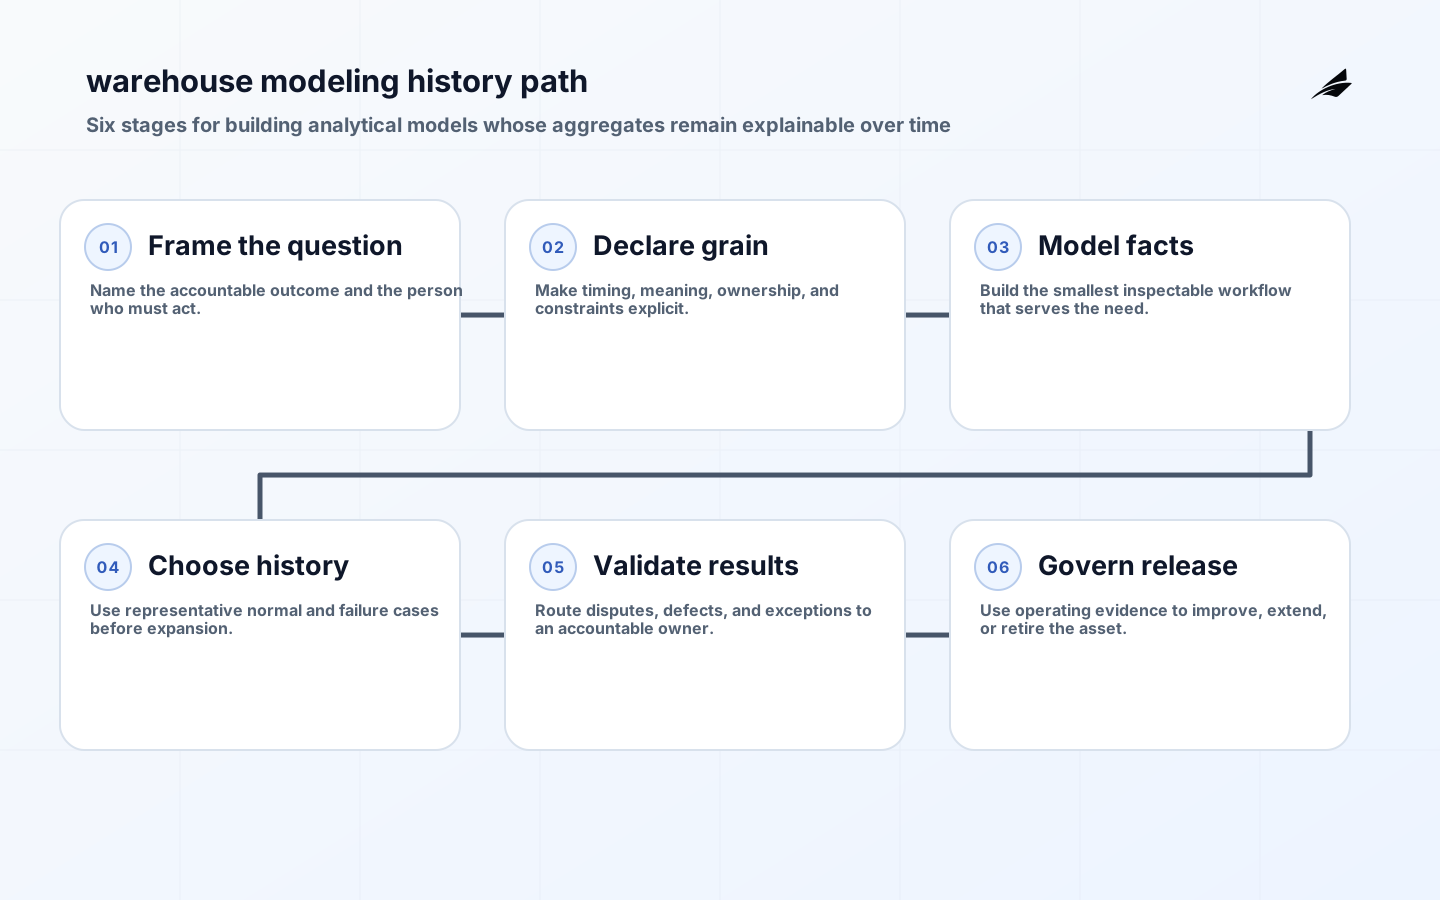
Warehouse modeling is the work of arranging data so that analytical questions can be answered consistently over time. It is not primarily about copying the shape of an application database into a reporting store. Operational systems optimize transactions and current state; an analytics model must make the business process, grain, history, and relationships clear to readers and tools. A practical model lets a team answer “what happened, to whom, when, and under which conditions?” without guessing how several normalized tables should be joined. The foundational choice is grain: what one row represents. Get that wrong, and every aggregate, relationship, and historical comparison becomes fragile.
Declare the grain before the columns
Warehouse modeling begins with a plain sentence about grain: what exactly does one row represent? For example, one completed order line, one account-day balance, or one support case transition. Without that sentence, columns and joins can look reasonable while producing incorrect counts and sums. The Kimball dimensional modeling techniques remain useful for separating measurable facts from descriptive dimensions and for treating conformed dimensions as a shared analytical asset. Microsoft's star schema guidance also emphasizes the relationship between model design and reporting performance. Decide deliberately how corrections, deletions, late-arriving records, and changing customer attributes affect historical truth. Validate with questions a real operator asks, not just with row counts. A model is ready when a reviewer can trace a surprising aggregate to its grain, source, relationship, and history policy without reading every transformation file.
For each fact, write a plain-language statement of the row. “One row per completed delivery,” “one row per invoice line,” and “one row per customer-day snapshot” are different models with different valid questions. The grain determines which keys are required, how measures aggregate, and how dimensions join. Do not add a new event type or a different time basis to an existing fact merely because the columns fit. Build a separate model or bridge when the process is different. This discipline prevents accidental fan-out and totals that change when a reader adds an apparently harmless dimension.
| Model choice | Best for | Watch for |
|---|---|---|
| Transaction fact | Individual business events | Duplicate events and late corrections |
| Periodic snapshot | State measured at regular intervals | Missing snapshots and changing snapshot grain |
| Accumulating snapshot | Lifecycle milestones for one process | Revisions to prior milestones |
| Dimension | Descriptive context for facts | Slowly changing attributes and matching keys |
Model facts and dimensions for questions
Facts record measurable events or states; dimensions describe the people, products, locations, channels, and dates through which those facts are analysed. Use conformed dimensions when different processes need a consistent view of a shared concept, but do not force a false unification when the business meaning differs. A customer in sales, support, and billing may require a matching policy and a visible source precedence rule. Give facts durable business keys and surrogate or warehouse keys where history requires them. Preserve the original identifiers for investigation. The model should make common joins obvious and unusual joins possible only with deliberate review.
- State the grain in the model description and test that uniqueness matches the statement.
- Use dimensions for stable descriptive context and document source precedence when attributes conflict.
- Keep measures at their natural grain; aggregate in queries or governed metrics rather than storing misleading pre-aggregations.
- Model many-to-many relationships explicitly with bridges and test their allocation or filtering behaviour.
- Retain business identifiers, load metadata, and source references needed to investigate a reported value.
Design for history and change
History is a business policy, not an accidental by-product of a load. Decide whether a changed customer region should rewrite historical sales or whether reports should retain the region known at the time. Decide how to represent a corrected transaction, deleted source record, or merged account. Each answer affects comparability and should be visible to consumers. Slowly changing dimensions, effective dating, and snapshots are techniques for implementing the policy; they are not automatically correct in every domain. Reconcile historical totals during migrations and backfills, and label material restatements so readers do not misread a modeling change as commercial movement.
| History event | Modeling decision | Reader implication |
|---|---|---|
| Customer changes region | Track attribute version or overwrite current state | Historical regional trend may differ by chosen policy |
| Order is cancelled | Retain event, update status, or create adjustment | Eligibility for revenue and service metrics is explicit |
| Source deletes record | Capture deletion marker or preserve prior state | Audits can explain why a value changed |
| Business key merges | Maintain mapping and survivor rule | Cross-system customer counts remain traceable |
Build and govern warehouse models
Warehouse models should be developed with sample questions and reconciliations, not only schema diagrams. Ask an analyst to calculate a known period, segment it in expected ways, and trace surprising results to the source. Test uniqueness, relationships, accepted values, freshness, and aggregate reasonableness close to the models. Use code review for grain changes, join changes, and new history logic. Publish descriptions, owners, and lineage so downstream teams understand the intended contract. Warehouse modeling mistakes and fixes is a useful companion when a model already produces inconsistent totals.
Work through a practical case
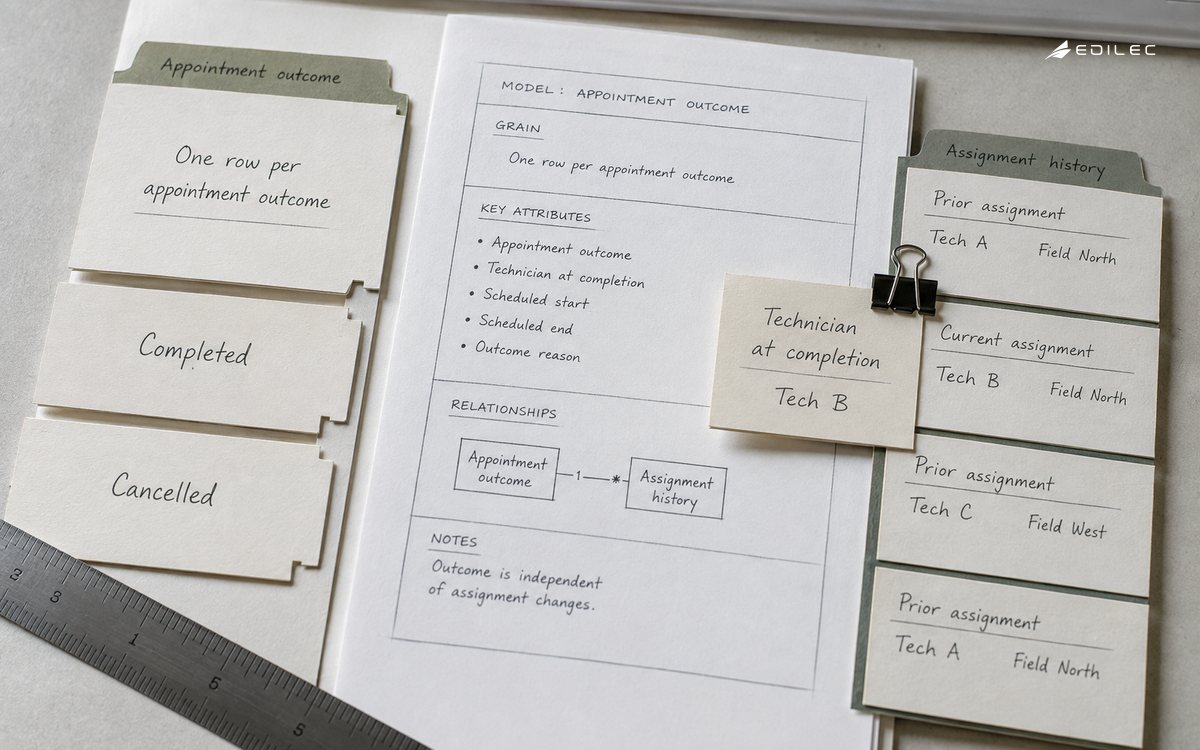
A service company wants to understand whether appointments are completed within the promised window. The team creates a fact at one row per appointment outcome, with booked, scheduled, arrival, and completion timestamps, plus an explicit cancelled state. Date, technician, customer, and service dimensions provide context. The on-time measure is calculated only for eligible completed appointments and uses the promised window stored at booking. When a technician is reassigned, the fact retains the responsible technician at completion while a separate assignment history supports operational investigation. This model makes both weekly service reporting and case-level follow-up possible without changing the definition in each dashboard.
Plan the next review
Review warehouse models with both a business scenario and a technical reconciliation. Choose a recent period, calculate a known result from source evidence, then repeat the question through the published fact and dimensions. Change common filters and dimensions to make sure relationships do not multiply or lose records. Review a historical correction and ask whether the model's history policy gives the reader the intended comparison. This practice catches the errors that schema diagrams miss: grain ambiguity, mismatched keys, unexpected fan-out, and a source migration that changed the meaning of a field. Treat the review results as model-change evidence and keep them with the release, especially for models that feed executive, financial, or customer-facing reports.
- Test the declared grain with uniqueness checks and a small set of source-backed examples.
- Reconcile one aggregate and one segmented result after relationship or history changes.
- Review bridge tables and allocation rules with the business owner before exposing new many-to-many analysis.
- Check whether slowly changing attributes support the historical question readers actually ask.
- Publish an impact note when a backfill or remapping changes a previously reported period.
Physical performance choices should be revisited as use changes, but they must not obscure model meaning. Partitioning, clustering, materialization, and aggregation can improve a workload when they are attached to known query patterns and retention needs. Document those choices and test that an optimization does not change grain or eliminate records needed for investigation. When performance pressure leads teams to create summary tables, define their refresh and reconciliation relationship to detailed facts. This keeps speed improvements from becoming a second, silent definition of the business.
Connect the practice to the wider data system
Warehouse modeling gives downstream layers stable material to work with. Use warehouse modeling field guidance for implementation choices, dbt models for reviewable transformations, and dbt models checklist to turn tests, documentation, and release controls into an everyday delivery practice.
Key takeaways
- Declare what one row represents before designing columns, joins, or measures.
- Model facts for events or states and dimensions for the descriptive context readers need to segment them.
- Make history, correction, deletion, and key-matching policies explicit business choices.
- Test common questions and reconciliations against source evidence before broad release.
- Treat grain and relationship changes as reviewed changes because they can alter every downstream total.
FAQ
Should every warehouse use a star schema? Dimensional structures are often effective for BI and understandable querying, but the right model depends on the workload, source patterns, governance needs, and performance constraints. The important principle is clear grain and relationships. What is a fact table? It records a measurable business event or state at a stated grain. A fact table can contain foreign keys to dimensions and numeric measures, but its defining feature is the business process and row meaning, not a fixed list of column types.
Conclusion
Warehouse modeling gives analytics a durable structure for asking and answering business questions. Put grain first, make facts and dimensions serve real decisions, choose history policies consciously, and validate results against source evidence. Those habits make the model easier to extend and make downstream dashboards far less likely to disagree about what a number means. Model design should also make operational trade-offs explicit. A highly normalized structure may preserve source fidelity, while a dimensional model may improve analytical clarity and performance; teams can use both at different layers when the lineage and contracts are understood. Avoid changing a core model only to accommodate a one-off visual request. Instead, ask whether the request reflects a new business process, a reusable analytical question, or a temporary exploration. This keeps core models stable enough for trust while giving analysts a sensible route to new work.