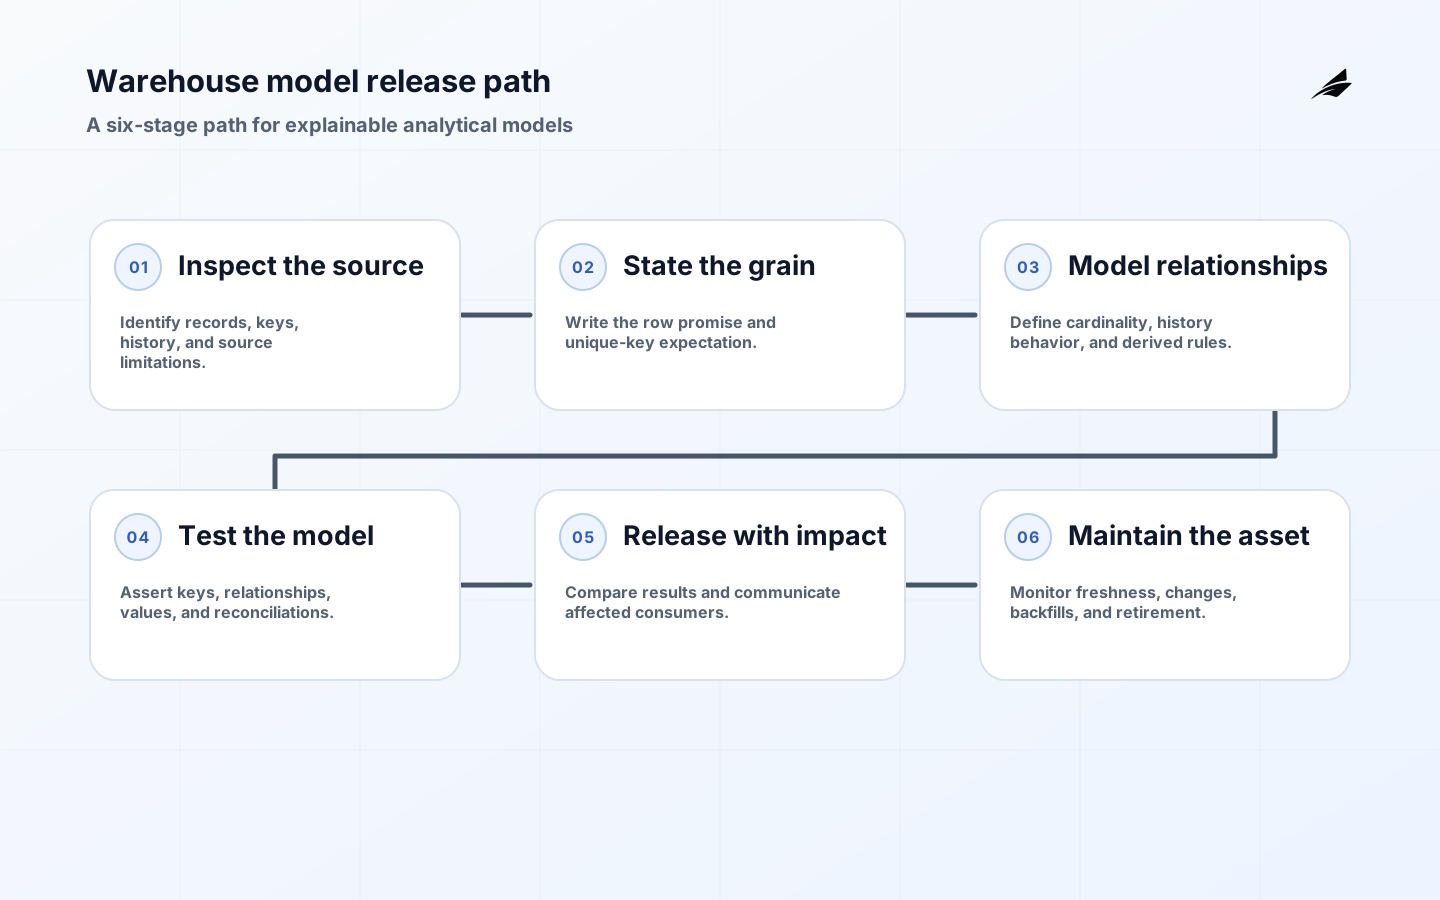
Warehouse modeling mistakes are dangerous because they often look reasonable in a dashboard. A fact table joined to a dimension at the wrong grain can multiply revenue, a mutable customer attribute can rewrite history, and a convenience view can hide a poorly defined business concept. The remedy is not a single preferred schema. It is disciplined modeling: state what each row represents, declare the keys and relationship cardinality, preserve the history needed by the decision, and test the results against source evidence. Microsoft governance guidance connects ownership and policy to data management, dbt data tests show how to encode assumptions, NIST’s DGM Profile frames governance priorities, and Google Cloud’s data architecture overview gives the broader path from data to use.
Declare row grain before modeling a measure
The grain is the promise made by a table: one row per invoice line, subscription day, shipment, or customer-month. Write it in the model description and review it before adding metrics. Many warehouse modeling failures start when a model silently becomes “one row per whatever joined successfully.” If a report needs daily account activity, model that deliberately rather than joining events to an account snapshot and hoping aggregation corrects it. The grain determines valid keys, allowed joins, freshness expectations, and the right tests. It also tells a future contributor what a count actually counts.
- Describe every fact model in one sentence beginning with “one row represents.”
- Identify the unique key and test it on every production run.
- Separate event facts, periodic snapshots, and accumulating process facts.
- Document relationship cardinality before joining two published models.
- Use a date spine deliberately for zero-activity periods instead of manufacturing records.
For adjacent practice, compare the metric layers implementation checklist with the data lineage architecture guide. The first sharpens metric contracts; the second makes the path from source to decision traceable when a model is challenged.
Protect keys, cardinality, and historical meaning
Natural keys are useful evidence, but operational systems reuse, correct, and merge them. Keep the source key, then use a stable warehouse key where history and relationships need it. Choose history behavior by the question, not fashion. A current-state customer segment may be appropriate for a service queue; a revenue trend by segment may need the segment as it was when the transaction occurred. Record effective-from and effective-to rules, deletion treatment, and late-arriving behavior. This is the same documentation discipline covered in data model documentation, applied to the models people actually query.
| Common mistake | Why it misleads | Practical fix |
|---|---|---|
| Grain not defined | Counts and sums change after an innocent join. | Write the row promise and test the unique key. |
| Many-to-many join | Measures are duplicated across related records. | Bridge deliberately, aggregate first, or change the question. |
| Current attributes for historical analysis | Past results are recast without notice. | Choose and document the effective-date behavior. |
| Hidden source cleanup | Readers cannot distinguish a correction from a business event. | Retain source evidence and publish transformation logic. |
Test transformations against source evidence
A warehouse model should expose how it was produced: the input models, business rules, tests, owner, and intended consumers. Tests are most useful when they express a real invariant: a primary key is unique, a required foreign key resolves, a status is permitted, or an aggregate reconciles to a controlled source. dbt data tests document this executable-assertion approach. For complex calculations, supplement generic tests with a small set of worked examples that a business reviewer can verify. The examples make it easier to catch a wrong time zone, reversal rule, or late-arriving record policy.
- Test uniqueness, non-null fields, accepted values, and relationships at the model boundary.
- Reconcile material aggregates to accountable source totals by period.
- Keep business-rule changes in reviewable version control.
- Publish model owner, consumers, and freshness alongside the model.
- Alert on failed tests with a named route for triage and resolution.
Release changes with lineage and recovery context
Treat a model change as a product release when it affects downstream meaning. Compare old and proposed outputs for representative periods, identify breaking schema changes, and communicate whether history has been rebuilt. Release notes should distinguish a bug correction from a definition change and explain who must revalidate a report. The NIST data governance profile provides useful organizational context for assigning responsibilities around data management. Pair that governance with the pipeline considerations in data pipeline planning so recovery and backfill are designed, not improvised.

| Change type | Evidence before release | Reader communication |
|---|---|---|
| New model | Sample records, key tests, and documented grain. | Purpose, owner, and supported use cases. |
| Logic correction | Before-and-after comparison and root cause. | Affected dates, metrics, and expected restatement. |
| Schema change | Compatibility assessment and migration plan. | Deprecation date and replacement fields. |
| Backfill | Record counts, freshness status, and reconciliation. | Periods rebuilt and remaining limitations. |
Choose a model shape that matches the business event
Consider a company that wants a monthly account-level view of recurring revenue. The source system may contain subscription versions, invoice lines, credits, cancellations, and account relationships. A workable model does not simply join all of them and sum an amount. It decides what one row represents, such as an account-month-subscription component, preserves the source identifiers, and makes the effective-date policy visible. A separate model can then aggregate the components into the account-month measure used in a dashboard. That separation makes it possible to inspect a surprising result without asking a reader to understand every low-level transaction.
Now consider a credit issued after the original invoice period. The analytics team must decide whether the report reflects the credit in the month issued, restates the original period, or provides both operational and accounting views. There is no universal answer, but there must be a documented answer. The choice affects comparability, ownership, and reconciliation. A model description, test fixture, and release note can express the treatment clearly. Without those artifacts, different reports often make different choices, and leaders end up debating a definition when they believe they are debating performance.
A useful quality gate for this model combines structural and business checks. Test that the declared key is unique and that subscription relationships resolve. Then reconcile the monthly aggregate to an accountable source total under the agreed policy, and inspect a few accounts with upgrades, cancellations, credits, and parent-account changes. The sample is not a substitute for automated testing; it demonstrates that the tests and transformations reflect real business behavior. As the product changes, retain those cases as a living regression set so new logic does not quietly undo an established rule.
- Write the grain and intended consumer beside every published warehouse model.
- Test the declared unique key after each build and investigate every unexpected duplicate.
- Document cardinality before joins and prohibit silent many-to-many expansion in production models.
- Preserve source identifiers needed to reconcile a derived result with accountable records.
- Choose effective-date behavior explicitly for mutable dimensions and historical reporting.
- Keep model descriptions current when a source system changes fields, rules, or retention.
- Use representative fixtures for credits, reversals, late arrivals, merges, and deleted records.
- Compare material aggregates to source control totals by a documented reporting period.
- Review downstream impact before changing a model schema, definition, or key.
- Assign owners for model meaning, technical delivery, and incident response.
Make model review concrete by choosing a small number of business scenarios that must remain correct. For a subscription model, that might include an upgrade mid-month, a cancellation followed by reactivation, a parent-account reassignment, and a late correction from billing. Store the expected result and the underlying source references with the model’s tests or documentation. When a contributor changes logic, these cases reveal whether the model still honors its stated time and relationship rules. They also give nontechnical reviewers a way to validate the release without reading every transformation query.
Scenario: revenue doubles after a dimension join
When a dashboard total looks too high, start with a row-count and grain trace rather than adding DISTINCT. Take one reporting period and compare the source control total, the fact model total, and the published aggregate. Count rows before and after each join, then group by the key that should be unique. If orders rise from 10,000 to 12,400 after joining a promotions table, inspect whether one order has several eligible promotions and whether the metric is meant to count orders or order-promotion combinations. The discrepancy is evidence about model shape, not a request for cosmetic deduplication.
Write the correction as a decision: aggregate promotions to order grain, introduce a bridge with an explicit allocation rule, or change the report question. Preserve a before-and-after sample containing a normal order, a multi-promotion order, a cancelled order, and a late adjustment. Re-run the unique-key, relationship, and reconciliation tests, and note whether historical periods are restated. This workflow helps a reviewer see why the fix is safe and keeps the model description aligned with what the query actually produces.
Key Takeaways
- A table’s grain is the foundation of correct analytical joins.
- Keys and effective dates must reflect the business relationship, not only source convenience.
- Executable tests should express real data promises.
- Model releases need the same clarity about impact as application releases.
Reference checkpoints for warehouse grain and join behavior: Use Power BI star schema guidance to check warehouse grain and join behavior at definition time. Use dbt data tests to check warehouse grain and join behavior at release time. Use BigQuery query computation best practices to check warehouse grain and join behavior at review time. Use Snowflake micro-partitions and clustering to check warehouse grain and join behavior at exception time. Use NIST Data Governance and Management Profile to check warehouse grain and join behavior at recovery time.
Frequently Asked Questions
Use these questions to challenge grain, joins, and model changes before a plausible total becomes a trusted one.
Conclusion
Warehouse modeling is an exercise in making business events durable and interpretable. Begin with the row promise, keys, and time behavior, then build transformations that preserve source evidence and are easy to test. Performance and convenience matter, but they should follow a model that readers can explain. When a result is challenged months later, the ability to trace it through documented grain, rules, and releases is what turns a warehouse into a dependable analytical foundation.
For warehouse modeling, durability starts with a row promise that survives joins, restatements, and team turnover. Keep grain, keys, history rules, tests, and ownership visible together so a useful result can be defended without reverse-engineering the SQL months later.
Reproduce a doubled revenue total by materialising the rows before and after a dimension join. Compare key uniqueness, relationship cardinality, and the affected period; then record whether the fix changes history or only future loads. The acceptance evidence is the before-and-after result plus the declared grain, not a new DISTINCT added without explanation.