Analytics Documentation: Definitions for Real Decisions
Analytics documentation is a decision aid, not a catalog label. A reader should be able to tell what a measure means, which population it covers, when it is current, where it came from, who owns it, what limitations apply, and how change will be communicated. If an operations leader uses a weekly backlog measure to staff a team, the page must show the work unit, time boundary, exclusions, refresh cutoff, and response to missing data. Begin with that decision and make every definition serve it.
Write the definition around the decision moment
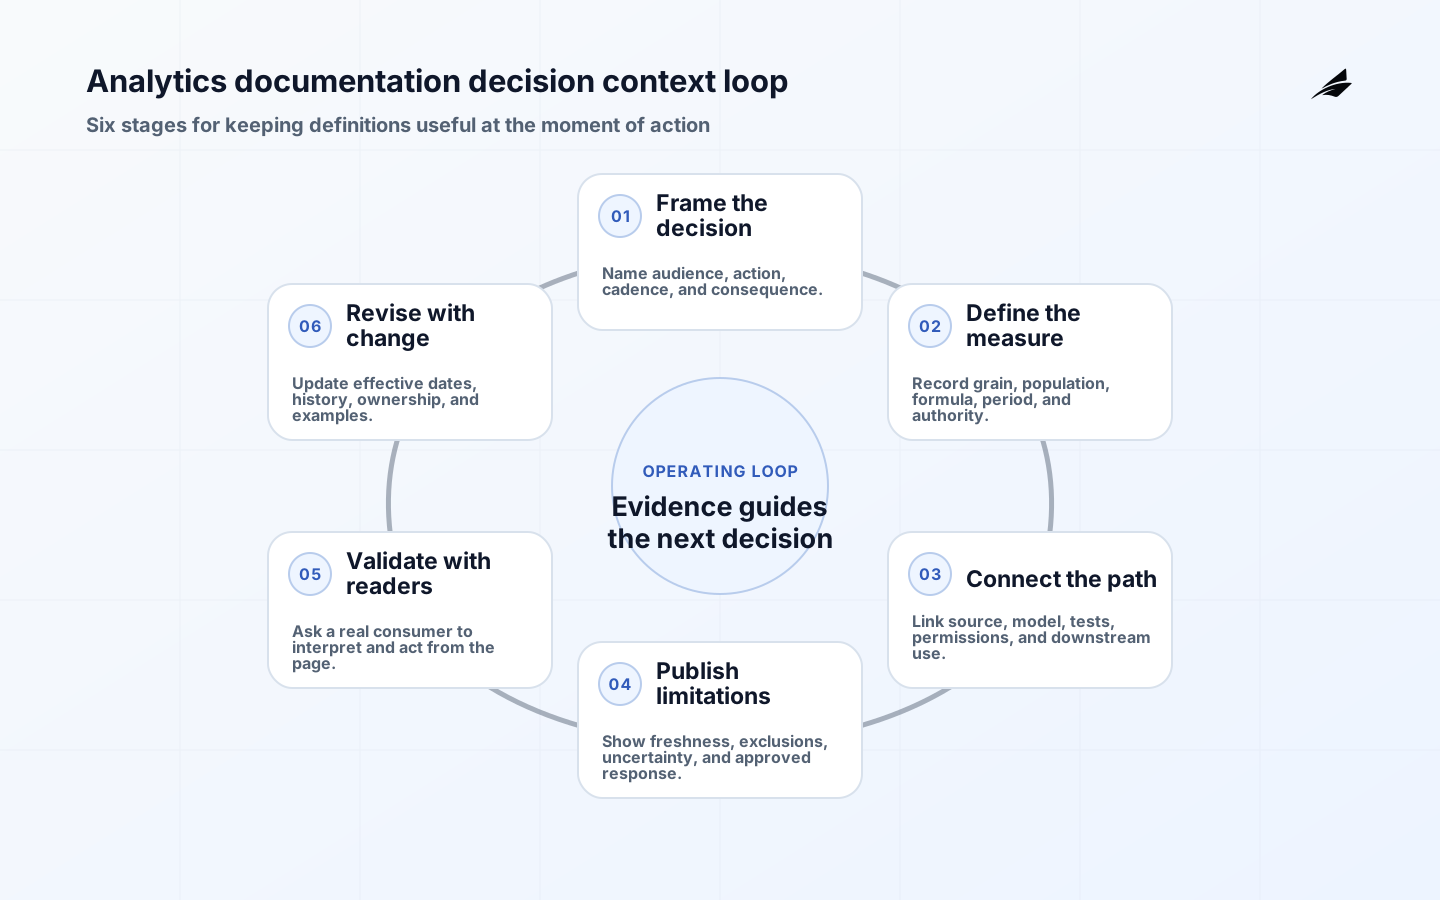
Write a short decision statement: who uses this output, what action can it change, and at what cadence? Then identify the measure's grain, population, source authority, calculation, time zone, freshness expectation, and known exceptions. A revenue metric may be booked revenue for a closed period, not a live estimate; an active-user metric may depend on a product event definition that changed last quarter. Record examples and counterexamples because users often understand a definition faster through a concrete case. Microsoft guidance places content ownership, governance, security, monitoring, and user enablement inside a broader adoption model; apply that same discipline so documentation has a product owner and a review cadence.

| Documentation field | What it should answer | Useful example |
|---|---|---|
| Purpose and audience | What decision does this support and who may use it? | Monday staffing review for support leads. |
| Definition and grain | What is counted, at what row or event level? | One completed case per case ID, closed in local time. |
| Freshness and status | When is it current and how is delay shown? | Refreshed by 08:00 UTC; prior cutoff shown when late. |
| Ownership and change | Who resolves ambiguity and approves definition changes? | Support operations owner with analytics steward as maintainer. |
Keep meaning beside the metric's changing state
Documentation should travel with the asset and surface at the point of use. Capture source descriptions near ingestion, model definitions near transformations, field and metric explanations in the semantic layer or BI model, and limitations in the report or API that a reader actually opens. Link the layers so a reader can move from a KPI to its model, source, owner, test state, and change history. BigQuery and Snowflake each organize analytical work around objects, datasets, schemas, and permissions; the names help operators, but names alone do not explain business meaning. Documentation and tests from dbt can keep model descriptions, dependencies, and assertions close to code, while BI guidance helps teams make model, lifecycle, security, and monitoring choices visible to report users.
Do not document every field with equal effort. Prioritize metrics in commitments, incentives, executive reviews, customer communications, regulatory reporting, and automated decisions. A useful page can show the authoritative source, transformation version, data owner, last validation, known caveats, and related reports. If the definition is disputed, document the current decision and the open question rather than hiding ambiguity behind a polished description. The dbt model security review is a helpful companion when documentation reveals a sensitive field or an audience that needs a different model.
Show readers freshness, exclusions, and uncertainty
Trust grows when documentation says what can go wrong. Describe source delays, missing populations, late-arriving records, timezone behavior, backfills, manual adjustments, and known changes in historical comparability. Pair each limitation with an action: wait, use the last certified cutoff, investigate a source, or proceed with a qualified result. A data quality score without context may create false assurance; show the dimensions that matter for the decision and the threshold that blocks use. For example, a daily fulfillment report may tolerate a two-hour delay but not missing warehouse events; a quarterly finance report may show a draft state until reconciliations complete. The user should not need to ask an engineer whether the output is safe to use.
| Quality context | Record | Decision aid |
|---|---|---|
| Freshness | Source cutoff, load completion, and late-data policy. | Use current, prior certified, or blocked state. |
| Completeness | Expected population, exclusions, and known gaps. | Assess whether the missing segment changes the action. |
| Definition change | Effective date, old/new formula, and historical treatment. | Compare like with like or label a break in series. |
| Access and privacy | Audience, sensitive fields, and approved detail. | Choose the right view or escalate access. |
Release documentation with the data product
Add documentation to the definition-of-done for a model, metric, dashboard, or dataset. A change request should state why meaning changes, which consumers are affected, how history will be handled, and when the new definition takes effect. CI can check for required descriptions, owner fields, classification values, and links to tests; a human still needs to judge clarity and business fit. Review documentation with someone who uses the output but did not build it. Ask them to explain the metric and choose an action from the page. If they cannot, the page has failed its purpose even if every metadata field is populated. Use the BI dashboard production guide when a dashboard becomes a recurring operational surface.
Measure usefulness rather than documentation volume. Track repeated clarification questions, conflicting definitions, stale owners, broken links, undocumented changes, usage of certified versus ad hoc metrics, and incidents where a limitation was missed. Sample a normal review, a late source, a definition change, and a permission question. Remove pages that duplicate authoritative content, but preserve the evidence that helps a reviewer understand historical decisions. Documentation should make change safer, not make the organization carry a static encyclopedia that nobody trusts.
Test one definition page with its real audience
Pick a metric that is already debated and rewrite its documentation as if a new manager must use it tomorrow. Put the purpose and audience first, then show the grain, formula, population, exclusions, period, timezone, source, freshness cutoff, owner, access route, and known limitations. Add a small worked example: three input records, the expected calculation, and the resulting value. Add a counterexample that shows what the metric does not count. Ask a reader to make a decision from the page without opening a private engineering ticket. Their questions reveal missing context more reliably than a metadata completeness percentage.
Keep semantic history visible. When a formula or source changes, state the effective date, whether prior periods are restated, which reports are affected, and how a reader should compare old and new values. If a metric is not certified for a use, say so and point to the appropriate alternative. Link documentation from the report, model, and catalog, but designate one authoritative definition so copies do not drift. This single-page exercise creates a standard that can be reused across dashboards, APIs, warehouse models, and operational exports.
Related Edilec reading: BI dashboards in production, event analytics in production, and semantic layers in production show how context travels into user-facing surfaces.
Source context: dbt documentation shows descriptions, Markdown blocks, and production-state context; Power BI governance guidance sets roles and policy-maintenance expectations; BigQuery Data Catalog provides concrete metadata fields for governance, quality, usage, and classification; and Snowflake access control clarifies the role boundaries documentation should explain.
Key takeaways
- Start documentation with the decision, audience, grain, definition, freshness, and owner.
- Put meaning where users work and link it to source, model, tests, permissions, and change history.
- State limitations and the action they imply; do not hide uncertainty behind a score or label.
- Make required metadata part of delivery, then validate clarity with a real consumer.
- Measure fewer clarification loops and safer use, not the number of pages created.
Frequently asked questions
Is a data catalog enough?
A catalog helps discover assets and relationships, but it does not automatically explain decision meaning, limitations, ownership, or approved use. Connect catalog metadata to model tests, report context, and a change process so the reader can evaluate fitness for purpose.
Who owns an analytics definition?
A business owner should accept the meaning and decision boundary; an analytics or data engineer can maintain implementation details. Shared contribution is useful, but one accountable owner must resolve conflicts and approve effective dates.
When should documentation change?
Update it with a source, logic, audience, access, or freshness change, and after an incident or repeated user question. A review cadence can catch stale owners and links, but event-driven updates are essential for semantic changes.
Take the weekly backlog measure as a documentation specimen. Put its grain, population, formula, cutoff, exclusions, source, owner, certified state, and approved response to lateness in one reader-facing page. Ask an operations leader to decide whether to staff from the value, qualify it, or wait for repair without an engineer present. Record every question that requires a second source. Those questions show where the definition, lineage, access rule, or limitation needs to move closer to the decision.
Analytics Documentation: a decision you can operate
Useful analytics documentation is a compact decision interface, not an archive of technical descriptions. Put meaning, scope, freshness, limitations, ownership, evidence, and change history where the person acting on the result can find them. Test the page with a real consumer and revise it when a metric, source, audience, access rule, or incident changes.
Use a weekly support-backlog metric as a documentation acceptance test. Write the decision first: a support lead assigns Monday capacity from cases open at the local 18:00 cutoff on Sunday. The metric page must then state its grain, included queues, treatment of reopened cases, timezone, source cutoff, late-arrival behavior, owner, access route, and certification state. Add a worked example with three cases, including one reopened case and one arriving after the cutoff, and show the expected count. Add a counterexample that explains why a case created in the next reporting period is excluded. Ask a support lead who did not build the model to answer whether the value is fit for Monday staffing without opening an engineering ticket. Record each question as a documentation defect or a legitimate policy decision. This test distinguishes a page that contains metadata from one that actually supports action.
The quality bar is simple: a reader should know whether to use, qualify, or hold an output and should know who can resolve remaining uncertainty without opening a chain of informal questions.