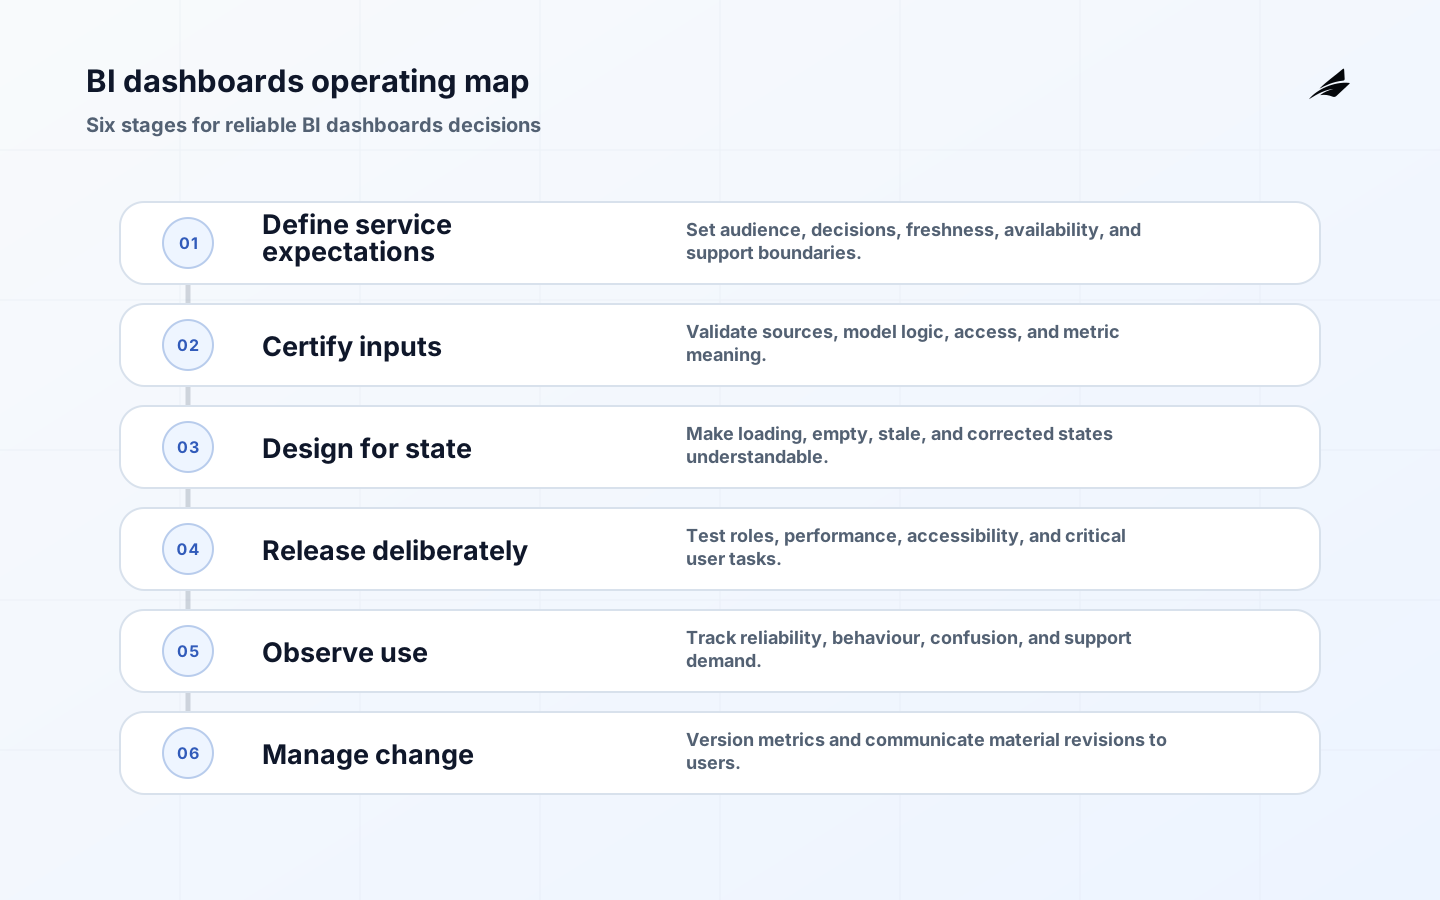
BI dashboards becomes valuable when it helps the business user and support team relying on it after launch make a better decision, not when it merely adds another technical artifact. The practical question is whether an analytical interface is dependable enough to become part of an operational routine. Begin with the intended decision, published metrics, refresh promise, authorised audience, and support boundary. That framing prevents a common failure: teams optimise an interface, schema, or job before agreeing how a reader will interpret its output. A management dashboard may be technically available while its most important number is a day behind. In production, the interface should expose the as-of time, explain the expected delay, and point to the escalation owner. Hiding the status preserves a tidy screen but transfers risk to the person making the decision. A dependable implementation makes the state of the evidence visible, gives people a way to challenge it, and leaves a trace when a definition or result changes.
Start with the decision BI dashboards must support
Treat a BI dashboard in production as a service around a recurring decision. Write down who acts, what they can change, which population is included, which clock applies, and what consequence follows if the information is wrong or late. The service boundary should also say what it does not promise. For BI dashboards, the relevant inputs are certified data sources, refresh schedules, model dependencies, role permissions, usage data, and support ownership. This is more useful than a generic requirements list because it lets a reviewer ask whether each input has a known owner, an expected arrival pattern, and an understandable exception state. The immediate aim is a small, observable path that earns trust before the scope expands.
| Decision question | Specific answer to record | Evidence to retain |
|---|---|---|
| Who acts? | Name the role with authority to change the outcome. | Owner, escalation route, and review cadence. |
| What is true? | State the grain, time policy, inclusion rules, and known exclusions. | Definition, examples, and version history. |
| When is it usable? | Declare freshness or latency expectations and correction behavior. | Status signal, run evidence, and incident notes. |
| What happens on doubt? | Offer a safe challenge, containment, or fallback path. | Ticket, decision log, and correction record. |
Define the BI dashboards promise
A promise connects business language to behavior that engineers can test. For this topic, capture certified data sources, refresh schedules, model dependencies, role permissions, usage data, and support ownership. Then state release criteria that cover data validity, security, performance, accessibility, and communication. Avoid vague claims such as “single source of truth” unless the scope and authority are named: many useful sources can coexist when their purpose is clear. Define identifiers, expected values, ownership, and compatible change rules at the point where a consumer can inspect them. Treating a dashboard as a finished presentation instead of a system with failures, changes, and users Clear promises also make handoffs calmer. A new analyst or responder can see which result is authoritative for a particular question and which result remains provisional, rather than reconstructing the answer from chat messages.
- Name a business owner and a technical owner for BI dashboards; either role alone is insufficient.
- Record the entity or event grain before publishing aggregate metrics or summaries.
- Put freshness, completeness, access, and known limitations near the result people use.
- Make material changes reviewable, dated, and understandable to affected readers.
- Keep an auditable exception route instead of silently correcting surprising records.
- Use realistic failure cases as acceptance criteria, not only a successful happy path.
Design BI dashboards for controlled change
The first design choice is how the asset changes without surprising its consumers. Break work into a declared input boundary, transformation or interpretation step, published result, and feedback route. A change should be assessed for meaning, access, performance, and downstream effect before it is released. A management dashboard may be technically available while its most important number is a day behind. In production, the interface should expose the as-of time, explain the expected delay, and point to the escalation owner. Hiding the status preserves a tidy screen but transfers risk to the person making the decision. dashboard adoption are often part of the dependency story, so their contract and recovery behavior deserve the same attention as the final interface. Prefer a small release with measured use over a broad launch. It produces evidence about confusion, latency, and missing context while the cost of correction is still low.

Test the uncomfortable cases before release
A production test is a question about behavior under conditions that actually occur. Verify that a reader can understand a delayed refresh, report a discrepancy, and avoid acting on an invalid result. Test the normal path, but also test empty input, changed definitions, delayed delivery, access denial, partial completion, and correction after publication. Use a small set of representative records or fixtures whose expected outcome is understood by both a domain reviewer and an engineer. This makes a discrepancy informative: it points to a rule, a contract, or a source rather than a vague claim that “the data looks wrong.” Where an action has financial, customer, or compliance consequences, make the safer fallback explicit and ensure the support team can invoke it.
| Operating moment | Control | Useful signal |
|---|---|---|
| Before release | Review definitions, ownership, permissions, and consumer impact. | Approval and test evidence linked to the change. |
| Normal operation | Publish status with the result and monitor declared checks. | Freshness, completion, quality, and usage trend. |
| Exception | Contain impact, preserve evidence, notify readers, and correct safely. | Time from detection to understandable status. |
| After correction | Explain material movement and improve the failed control. | Repeat incident rate and unresolved follow-up. |
Operate BI dashboards as a living service
After launch, the work shifts from construction to stewardship. Monitor refresh reliability, view and repeat-use rates, query failures, support tickets, and time to resolve a metric dispute. These measurements should support a conversation, not become targets detached from the decision. A low error count can mean a reliable service, or it can mean users have stopped reporting problems because the route is unclear. Review a sample of real decisions: did the reader understand the time boundary, did the evidence change the action, and could the owner explain a discrepancy? Keep a brief incident record that captures affected consumers, source state, containment choice, and durable fix. That record turns operational noise into design input for the next release.
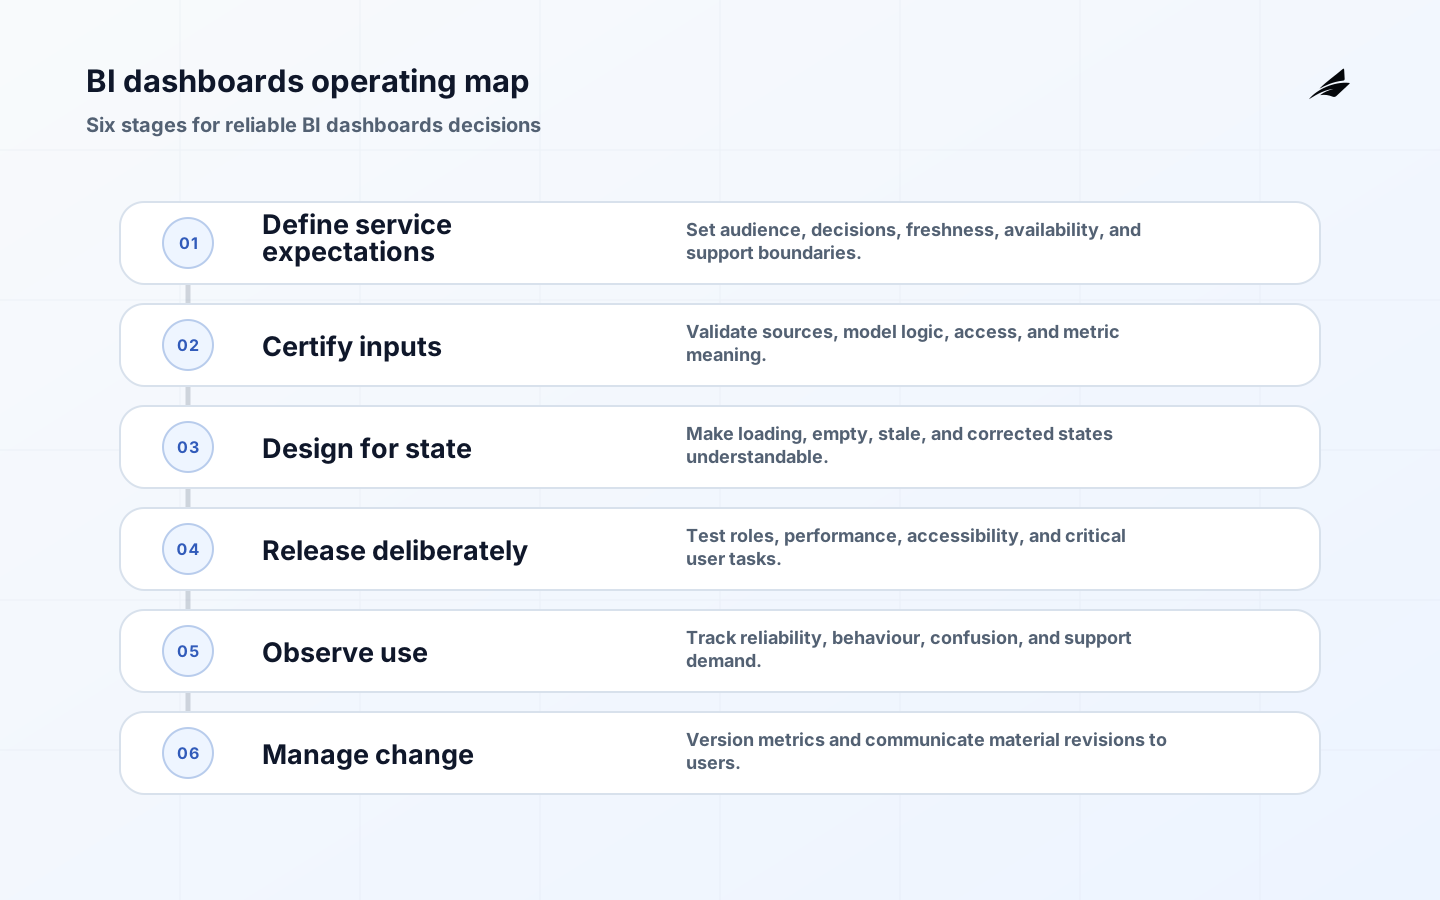
Measure whether BI dashboards changes work
Adoption and reliability are complementary. Usage without trust produces ritual; reliability without use produces an unused asset. Establish a baseline before changing the workflow, then compare observed behavior after release. For BI dashboards, watch refresh reliability, view and repeat-use rates, query failures, support tickets, and time to resolve a metric dispute. Segment those signals by audience and use case, because an executive reader, an operator, and an analyst may need different latency, detail, and correction policies. Pair quantitative evidence with short interviews or support reviews. The strongest improvement candidates are the places where users repeatedly leave the service, create a shadow calculation, or ask the same interpretation question.
Key takeaways for BI dashboards
- BI dashboards starts with a named decision and a clear boundary, not a tool choice.
- Definitions, ownership, freshness, and exceptions are part of the product the reader receives.
- Production readiness includes recovery, communication, and change control as well as a working build.
- Test representative failure modes and preserve evidence so corrections are explainable.
- Measure trusted use and decision quality alongside technical delivery signals.
Frequently asked questions about BI dashboards
When is BI dashboards ready to use? It is ready for a limited audience when the intended decision, source boundary, owner, status signal, and exception path are explicit and have been exercised with realistic data. Wider release should follow evidence that readers can interpret the result and responders can correct it safely.
Who should own BI dashboards? The accountable business manager owns the decision workflow and prioritises fixes; a BI owner runs the published asset, access, and support path. Metric owners should approve definitions that affect several audiences, especially when reporting is used for performance management.
How often should BI dashboards be reviewed? Review BI dashboards at each material metric or source change, and periodically with the people who use them in meetings or daily operations. A spike in support questions, stale refreshes, or abandoned views is a stronger trigger than an arbitrary publishing calendar.
Conclusion: make BI dashboards explainable
The durable version of BI dashboards is explainable under pressure. A reader can tell what it means, when it is current, who owns it, and what to do when it changes. Build that clarity into definitions, controls, interfaces, and support rather than adding it after a dispute. Start with one consequential decision, test the uncomfortable cases, and improve from real evidence. That creates a service people can use with appropriate confidence instead of a technical artifact they have to work around.