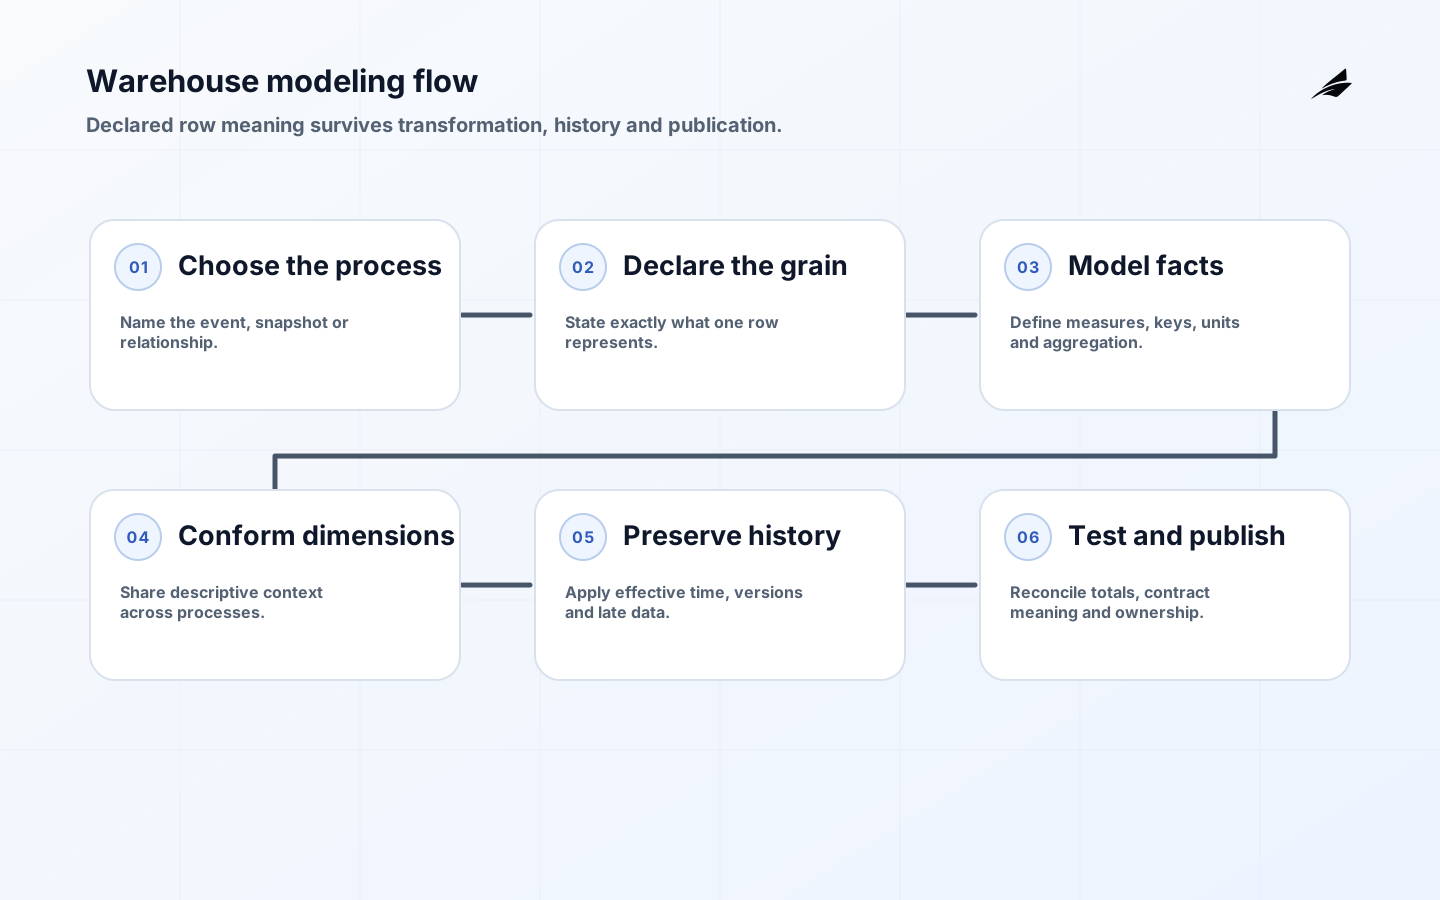
Warehouse modeling arranges analytical data so people and tools can ask consistent questions over time. It is not a mechanical copy of application tables. Operational systems optimize current transactions; an analytical model must make business processes, row meaning, history and valid aggregation explicit. A strong model allows a reader to answer what happened, to which entity, when and under which conditions without reverse-engineering normalized application schemas or relying on dashboard-specific joins.
The foundational choice is grain: the plain-language statement of what one row represents. Grain controls keys, measures, dimensions and valid comparisons. Use this guide with Edilec's warehouse modeling mistakes and fixes and ELT workflow planning guide. The semantic-layer engineering guide explains how governed metrics should consume the warehouse.
Start with a business process and declare the grain
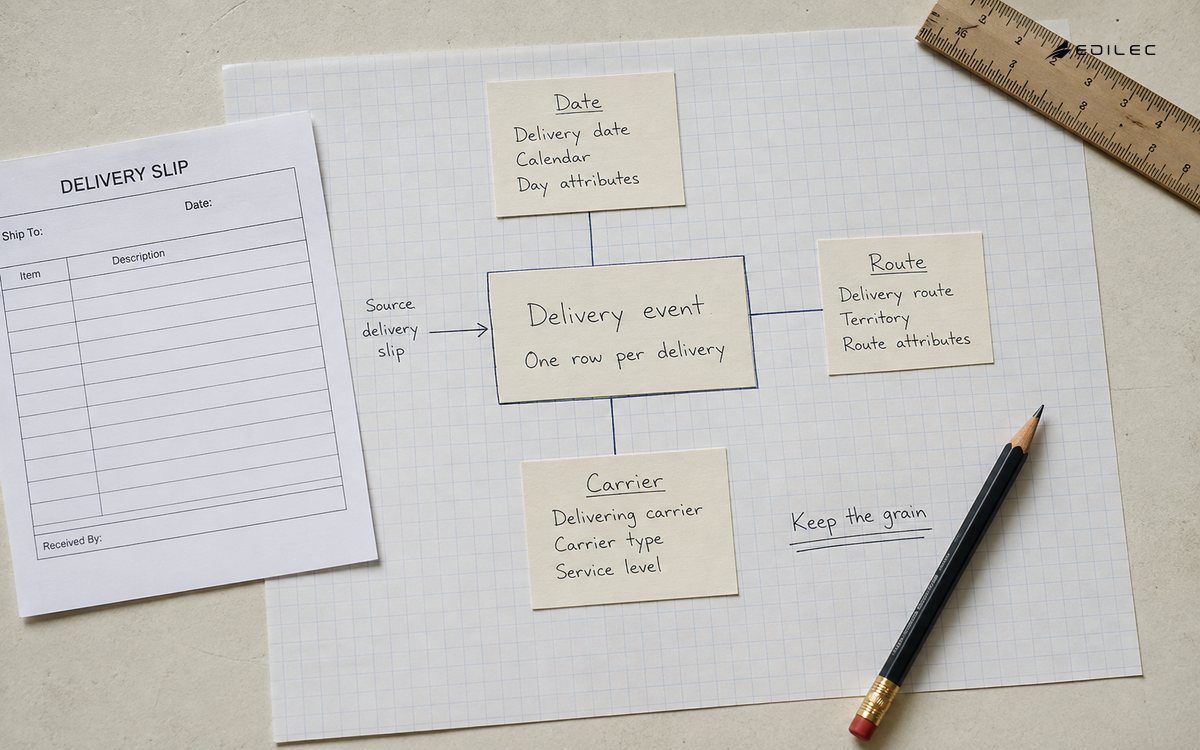
Choose a measurable process such as order lines, payments, shipments, support interactions or daily account balances. Write one row per completed delivery, one row per invoice line or one row per customer-day snapshot. Those are different grains with different valid questions. Do not mix events, periodic snapshots and current state because their time and aggregation behavior differ. If two event types merely share columns, that does not make them one fact.
Identify dimensions available at that exact grain and measures produced by the event. A delivery event may relate to shipment, customer, carrier, origin, destination, service level and delivery time. Order value may not belong if a shipment contains part of several orders unless allocation is defined. Test uniqueness at the declared grain. Preserve source transaction identifiers as degenerate dimensions when users need to trace a fact without creating a descriptive dimension.
| Fact pattern | Row meaning | Useful for | Common mistake |
|---|---|---|---|
| Transaction fact | One row per event or line | Volume, amount and process detail | Mixing different event types |
| Periodic snapshot | One row per entity and interval | Balances and trends | Summing snapshots across time |
| Accumulating snapshot | One row updated through milestones | Lifecycle duration and bottlenecks | Losing milestone history |
| Factless fact | One row per relationship or occurrence | Attendance and eligibility | Inventing a numeric measure |
| Aggregate fact | One row per defined rollup | Known high-volume queries | Treating it as atomic truth |
Separate facts from dimensions
Facts record measurements or occurrences; dimensions provide the descriptive context used to filter and group them. Microsoft's star-schema guidance describes dimensions as the structures for filtering and grouping and facts as structures for summarization. Keep dimensions wide enough to be understandable and avoid reproducing every source normalization. Conformed dimensions let separate facts use consistent customer, product, location and calendar meanings.
Classify measures by aggregation behavior. Additive measures can sum across all relevant dimensions. Semi-additive measures, such as account balance, may sum across accounts but not dates. Non-additive measures such as percentages require calculation from additive components. Store numerator and denominator where possible, then define the ratio in the semantic layer. Validate currency, unit and sign conventions. A column named amount is not meaningful without business event, basis and currency.
Model changing dimensions and event time deliberately
Decide whether analysis should use the current attribute or the attribute effective when the fact occurred. Type 1 handling overwrites an old value and is suitable for corrections or when history is not needed. Type 2 creates a new dimension version with effective dates and a surrogate key, preserving historical context. Type 3 keeps limited previous state in columns. Choose by analytical requirement; applying Type 2 to every field creates noise and load complexity.
Distinguish event time, ingestion time, processing time and effective business time. Late events should join the dimension version effective for the business event, not automatically today's version. Define how corrected and deleted source records affect facts. Keep an unknown dimension member so facts can load before reference data and be repaired later without breaking referential integrity. Monitor unresolved unknowns by source and age rather than hiding them in a generic bucket.
| Change situation | Model response | Historical question preserved | Required test |
|---|---|---|---|
| Spelling correction | Type 1 overwrite | Usually none | Business key remains unique |
| Customer moves region | Type 2 version | Region at transaction time | No overlapping effective periods |
| Order arrives before customer | Unknown member then restate key | Event retained without delay | Unknown backlog resolves |
| Late shipment event | Join by effective event time | Context when shipment occurred | Boundary-date case |
| Source deletion | Apply documented retention rule | Deletion or tombstone meaning | Reconciliation to source |
Handle many-to-many relationships without accidental fan-out
A direct many-to-many join can multiply facts and change totals. Use a bridge when one entity legitimately relates to several dimension members, such as a sale credited to several representatives. Define bridge grain, effective period and allocation weight. Weights should sum according to policy and remain reproducible. If users need both full-credit and allocated views, name the measures distinctly. Never rely on SELECT DISTINCT as a substitute for understanding the relationship.
Role-playing dimensions let one shared date dimension represent order, ship and delivery dates through separate keys. Hierarchies need stable level meaning and tests for orphaned or cyclic relationships. Ragged organizational structures may require closure or path techniques, but do not force every hierarchy into one table. The model should make common queries safe and obvious; specialized graph or operational relationships can remain outside the star when they do not support analytical aggregation.
Organize transformations into understandable layers
Preserve raw or source-aligned data with ingestion metadata and limited normalization. Use staging models to rename, cast, deduplicate and expose source concepts. Intermediate models implement reusable business transformations. Marts publish dimensional facts and dimensions for a defined domain. Dbt Labs' project-structure guide describes staging, intermediate and marts as purposeful layers. The names matter less than clear ownership and dependency direction.
Avoid a long chain of one-use views that obscures logic and makes cost unpredictable. Materialize based on volume, reuse, latency and platform behavior. Keep business rules in reviewed code rather than dashboard filters. Version contracts for published columns and measures. When changing grain or meaning, create a new model or version and migrate consumers; silently redefining a table leaves historical reports impossible to interpret.
Test structural integrity and business reconciliation
Test not-null and uniqueness where required, accepted domains, relationships, effective-date ranges, freshness and source reconciliation. Add business assertions: gross equals components, delivered cannot precede dispatched, quantities respect sign policy and allocated weights sum to the agreed total. Reconcile row counts and additive measures by source period and status. Store exceptions with reason and owner. A pipeline completing successfully proves execution, not model correctness.
Use representative fixtures for boundary dates, late events, duplicate source updates, unknown dimensions, many-to-many allocation, currency conversion and daylight-saving changes. Run impact checks against important metrics and consumer queries before release. The dbt models practical guide provides implementation detail. Profile actual query plans and cost; a logically elegant model still needs appropriate partitioning, clustering, indexing or materialization for its platform.
Publish ownership, provenance and model contracts
For each model, publish grain, purpose, owner, sources, refresh, keys, measures, dimensions, history behavior, quality objectives, access class, retention and consumers. W3C PROV-DM provides concepts for entities, activities and agents that can support interoperable provenance. Link documentation to deployed code and run evidence. A diagram without effective revision and ownership becomes misleading as soon as the first source changes.
Review models with domain experts using concrete questions and sample records. Ask them to explain one fact row, trace it to source and predict totals under a dimension filter. Monitor freshness, unknown-key age, test failures, restatements, query performance and use. Deprecate with consumer notice and a measured migration window. Remove unused models after retention and audit needs are met; every published table creates a support and interpretation obligation.
Tune physical design without changing semantic meaning
Use observed workloads to choose partitioning, clustering, indexing, distribution and materialization. Partition on fields that support pruning and lifecycle management, usually a relevant date, while avoiding tiny partitions and filters that cannot prune. Cluster or index selective join and filter keys according to platform behavior. Precompute expensive stable aggregates only when their grain, refresh and reconciliation are explicit. Measure scanned data, execution time, concurrency and cost with representative predicates, not one warm-cache query.
Performance changes must preserve row counts, totals, history and access rules. Compare query results before and after, test late-arriving updates and verify that incremental logic revisits the necessary period. Watch for skew around unknown keys or large tenants. A faster table that drops corrections or changes an outer join is a data defect. Keep semantic models independent of physical optimization where practical so storage can evolve without forcing users to relearn business meaning.
Warehouse modeling FAQ
Is star schema still relevant on cloud warehouses and lakehouses?
Yes for many business-facing analytical workloads. Storage engines have changed, but users still need explicit grain, dimensions and aggregation behavior. Other forms may suit data science, logs or graph questions; publish a dimensional interface where consistent analysis benefits.
When is one big table acceptable?
A denormalized table can serve a stable, high-volume use at one grain. Document duplication, history and measure behavior, derive it from governed models, and avoid making it the only representation when several facts or reusable dimensions are involved.
Should warehouse models mirror source systems?
Source-aligned staging is useful for traceability, but published models should represent analytical business processes. Mirroring operational normalization transfers source complexity and change into every report and often obscures historical meaning.
Key takeaways
- Declare one row's business meaning before choosing columns or keys.
- Separate process facts from descriptive dimensions and classify measure behavior.
- Choose history treatment from the question users must answer.
- Use bridges and allocation policy for legitimate many-to-many relationships.
- Test reconciliation, publish contracts and version semantic change.
Conclusion: make row meaning durable
Warehouse modeling is successful when a new analyst can understand a row, aggregate it safely, follow its history and trace it to evidence. Start with the business process and grain, add conformed context, model change deliberately and verify both structure and totals. That discipline remains valuable regardless of which warehouse, lakehouse or transformation tool stores the result.