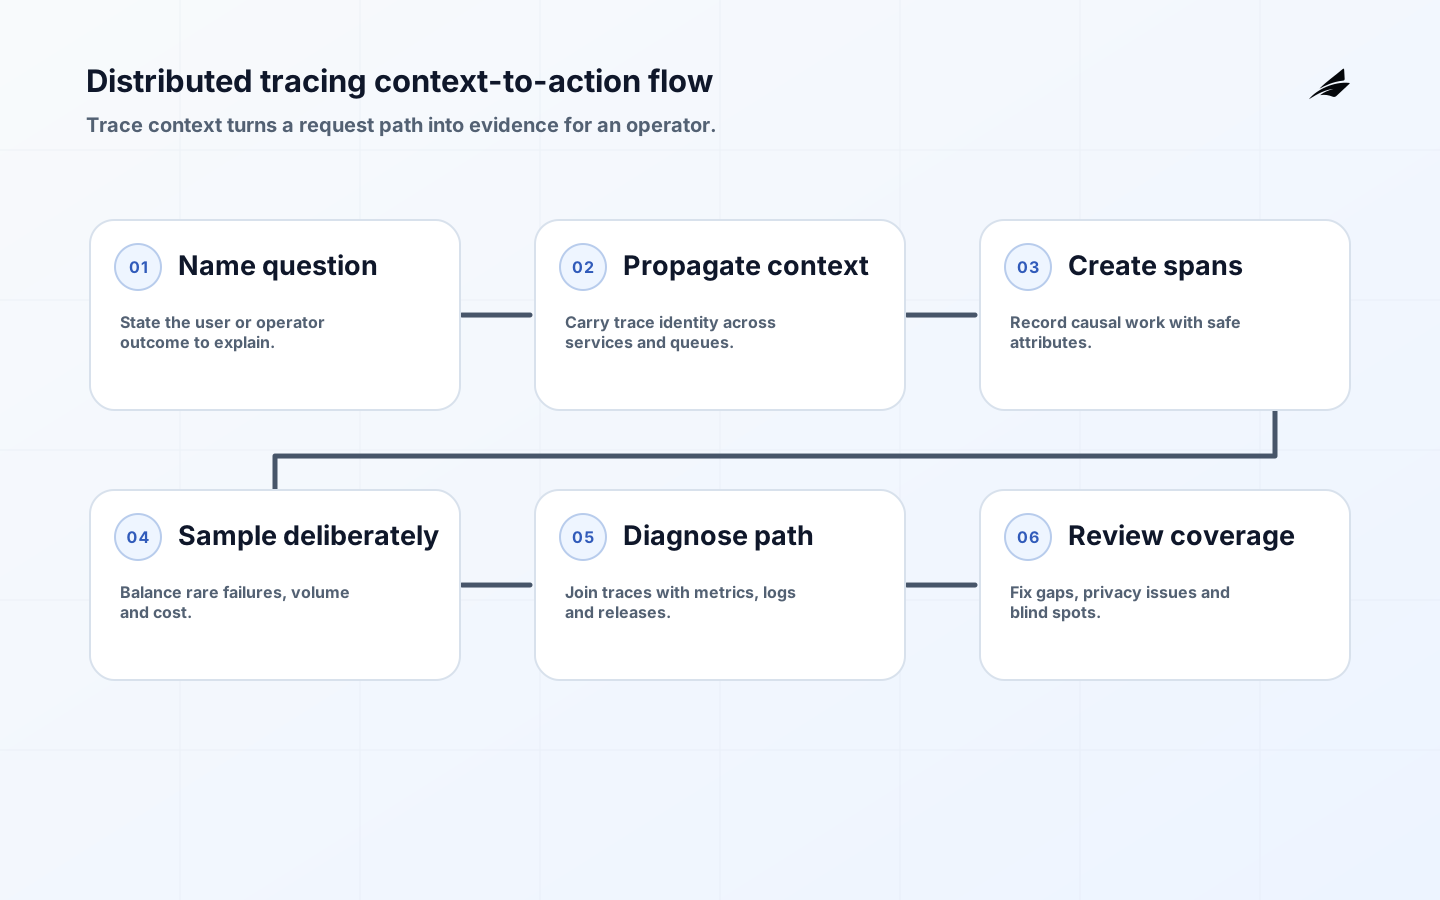
Distributed tracing deserves a plain-language operating model because operations leaders need to make choices that remain understandable after the first implementation. Distributed tracing records the path of a request as it crosses services, processes, queues, and data stores. A trace is made of spans; each span represents a timed operation with attributes, status, and parent-child or causal relationships. In a single service, a log line may be enough. In a system where an API gateway calls a catalog, payment provider, queue, and worker, tracing supplies the missing thread: which request was slow or failed, and where did its time go?
Key takeaways
- Trace the user journeys and asynchronous flows that matter to service behavior.
- Propagate standard context across supported request and message boundaries.
- Use stable route templates and semantic names to control cardinality.
- Keep secrets and personal payloads out of span attributes.
- Sample with incident investigation in mind, not only storage cost.
- Use metrics to judge whether an individual trace represents a wider condition.
What distributed tracing means in practice
Choose the transactions that matter, then define how context will cross their boundaries. A trace identifier and span identifier are correlation values, not an authorization mechanism and not a place for customer data. W3C Trace Context standardizes headers for propagating context across service boundaries. Preserve that context for HTTP and messaging routes where supported, but establish a new root when work is intentionally independent. The boundary should make causality understandable without creating an accidental long-lived identifier for users.
| Decision area | Question to settle | Useful evidence |
|---|---|---|
| Trace | What end-to-end work is being followed? | Root identifier and causal relationships across components. |
| Span | What operation consumed time or failed? | Name, timing, status, parent or link, and safe attributes. |
| Context | How does causality cross a boundary? | Standard propagation headers or messaging metadata. |
| Sampling | Which detail is retained? | Policy that protects error and high-latency evidence. |
An operating model for distributed tracing
Instrument inbound requests, outbound calls, database operations, queue publish and consume steps, and important internal work. Use a stable service name and resource attributes for environment and deployed version. Name spans after meaningful operations or routes, not unique customer IDs or raw URLs that explode cardinality. Attributes should answer a diagnostic question: protocol, method, route template, dependency name, retry count, outcome, and safe error classification are usually useful. The OpenTelemetry semantic conventions provide a shared vocabulary so one team does not call the same dependency db, database, and postgres in three services.
Trace propagation implementation path
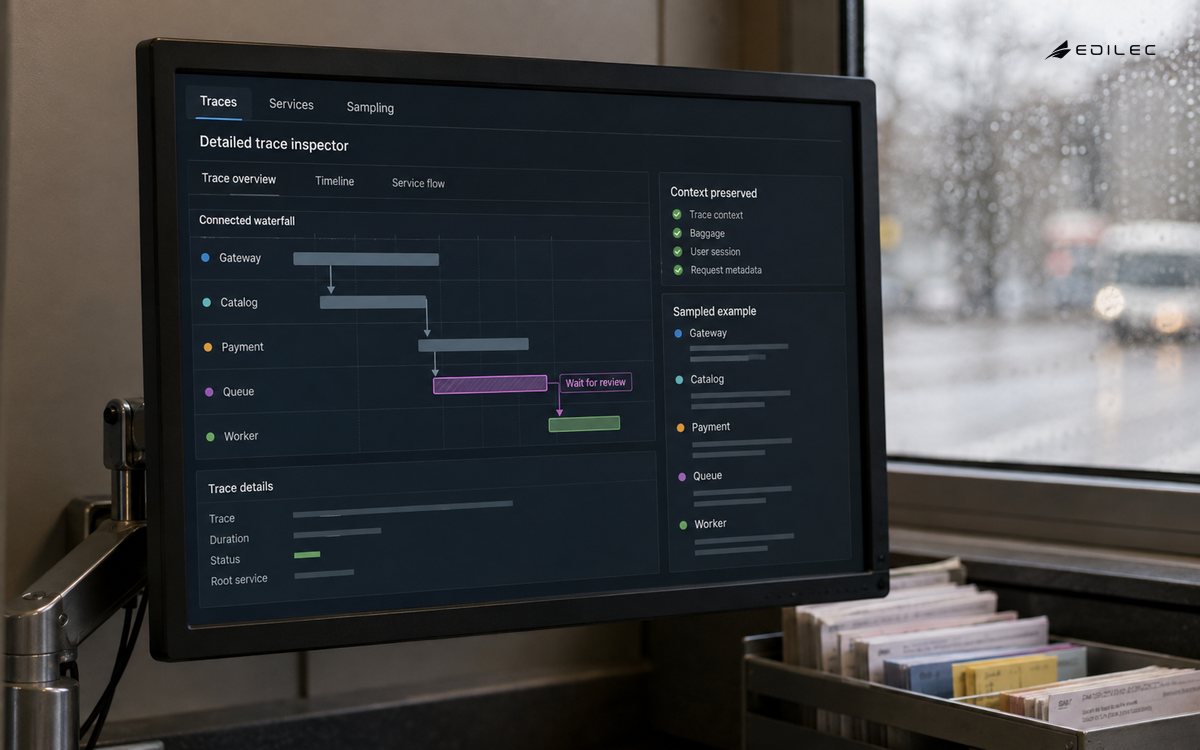
When an alert says checkout latency rose, start with a sampled trace for a slow successful request and a slow failed request. Compare the critical path, wait time, retries, and dependency behavior rather than assuming the service with the biggest local span is at fault. An asynchronous job needs explicit producer and consumer spans linked by propagated context; without that link, a queue delay can look like an unrelated worker problem. Combine traces with observability metrics to determine whether the trace is representative or exceptional.
Protect trace context and attributes
Tracing can create high cost and privacy exposure if teams record unrestricted payloads, queries, or unbounded attribute values. Define allowed attributes, redact sensitive fields before export, and use head, tail, or rule-based sampling according to the question. Keep errors and rare slow requests at a higher sample rate when possible, while limiting ordinary high-volume paths. Do not make a production incident depend on every trace being retained. Aggregate metrics and structured logs should preserve the broad signal when detailed samples are unavailable.
| Stage | What to check | Decision rule |
|---|---|---|
| Instrument | Add spans at user and dependency boundaries. | Attributes are templated, safe, and semantically named. |
| Propagate | Carry context through calls and messages. | Test missing-context behavior explicitly. |
| Inspect | Compare successful and failing critical paths. | Use metrics to determine population impact. |
| Refine | Remove noisy fields and retain missing diagnostic context. | Review sampling and privacy controls after real incidents. |
Use tracing signals that support action
Watch trace ingestion lag, sampling rate by route and outcome, spans dropped by the collector, orphaned spans, missing propagation at key boundaries, trace query latency, and the percentage of high-severity incidents that contain a usable trace. In the service itself, examine critical-path duration, downstream wait, retry volume, and error status by deployment revision. A trace dashboard is useful only when it makes one of those questions quicker to answer.
A distributed tracing checklist for the next change
Trace one request that goes through a public API, an internal service, a database, and an asynchronous worker. Confirm that it has one coherent root or an explicit causal link, that route names are templated, that no secret or personal payload is exported, and that a failed dependency carries a useful error category. Then turn off one propagation link in a test environment; the resulting gap will show whether the team can recognize incomplete traces.
Context propagation requires boundaries beyond code libraries. Confirm that gateways, proxies, job schedulers, and message brokers preserve or deliberately translate the trace headers used by the system. When third-party providers cannot continue context, create a span that names the boundary and use an application correlation record where appropriate. This preserves an honest model of what is observable instead of drawing misleading parent-child relationships that imply unavailable evidence.
Work through an order trace
An order request enters through a gateway, validates in an order service, calls a payment provider, and publishes fulfillment work. The root trace and child spans show whether latency is in provider wait time, retries, or local serialization. The worker continues context when it consumes the message. Routes use templates such as /orders/{id}, and attributes use safe provider names and status categories rather than card details or raw payloads. The trace communicates causality without becoming an audit-data store.
Phase tracing adoption
Phase distributed tracing through one bounded service or workflow first. Establish the owner, evidence record, access boundary, and stop rule before standardizing a template or expanding automation with a distributed trace. The first implementation should expose its awkward dependency, not hide it behind a happy-path demonstration with a distributed trace. After the team can explain why the control exists and show its outcome, reuse only the conventions that made the decision clearer with a distributed trace. This avoids turning a local tool choice into a broad platform mandate before its operating assumptions are tested with a distributed trace.
Keep the working record close to the change. For distributed tracing, that means retaining the version or configuration involved, the person or automated identity that acted, the signal examined, the exception if there was one, and the recovery decision. This is not paperwork for its own sake. During a later failure, those few facts prevent responders from confusing an old condition with a new one or repeating an action whose effect is still unknown with a distributed trace.
Set a tracing review cadence
Review distributed tracing with real examples rather than a generic scorecard. Sample one normal outcome, one unexpected outcome, and one manual exception. Ask whether a new owner could locate the relevant evidence, understand the boundary, and decide what to do next without relying on private memory with a distributed trace. A repeated exception points either to a missing capability or to a constraint that should be made explicit with a distributed trace. In both cases, the review should create a small, owned improvement.
Run a deliberately limited exercise before widening use. Change one safe input, observe the stated signals, invoke the documented containment or recovery step, and verify that the intended service behavior returns with a distributed trace. Record where access, timing, or ownership was unclear. An exercise is successful when it reveals a practical weakness early enough to repair it, not when every participant follows the expected script with a distributed trace. That habit makes distributed tracing more dependable under ordinary pressure as well as during an incident.
Frequently asked questions
Question: What makes a trace useful? Answer: A useful trace propagates context across boundaries, contains meaningful spans and attributes, uses an intentional sampling policy, and connects the request to the user-visible outcome.
Question: How should tracing data be protected? Answer: Avoid sensitive payloads, control access and retention, redact attributes, and use tenant-safe identifiers so diagnostic value does not become a data-exposure path.
A trace is not a full audit log. It is a diagnostic representation of work and should carry only the context needed for that purpose. Sampling does not make tracing useless; it requires choosing which outcomes and routes must be retained. Traces complement metrics: a metric tells a team that latency rose across a population, while a trace shows the path of an individual request or job.
Conclusion
Distributed tracing turns a multi-service request into an inspectable path. Propagate context deliberately, name operations consistently, keep attributes safe and bounded, and retain the samples that explain errors and slow work. Used alongside metrics and logs, it replaces guesswork with attributable evidence.
Review one trace end to end
Distributed tracing is useful when a trace preserves enough context to explain a user-visible request across services, queues and asynchronous work. OpenTelemetry tracing concepts defines traces and spans as a causal structure; W3C Trace Context standardizes propagation so independent components can carry the same trace identity. Neither source determines what to sample or retain, so those decisions belong in the operating model.
Trace a normal request, a slow dependency call, an error and a sampled-out path. Record service version, deployment, region, route and safe business identifiers, but keep secrets and sensitive payloads out of spans. Measure context propagation, sampling bias, collector loss, query latency, storage cost and time-to-diagnosis. A trace that cannot lead to an action is expensive decoration. See the observability guide, log aggregation, and distributed tracing buyers.
Further Edilec context: Observability guide, Log aggregation playbook, Distributed tracing buyer guide. The operating decision applies those references specifically to the plain-language guide to distributed tracing.
Source trail: OpenTelemetry instrumentation provides vendor-neutral instrumentation and collection; OpenTelemetry specification defines telemetry semantics; W3C Trace Context standardizes propagation; and Google SRE monitoring connects diagnostic signals to operational response. Trace design should be judged by the questions it enables an operator to answer.