Observability deserves a plain-language operating model because engineering teams need to make choices that remain understandable after the first implementation. Observability is the ability to understand a system's internal state by examining the signals it emits. It is more than collecting logs or installing a dashboard. A useful observability design lets a person ask a new question during an unfamiliar failure and find evidence without redeploying just to add basic context. Metrics summarize behavior over time, logs preserve discrete events, and traces connect work across components; each answers a different question and needs an intentional owner.
Key takeaways
- Define service indicators from the user's successful outcome.
- Use metrics, logs, and traces for their distinct diagnostic jobs.
- Attach consistent service, environment, and revision context to telemetry.
- Design alerts around symptoms, ownership, and a next action.
- Protect sensitive data and manage telemetry cost through intentional collection.
- Measure the observability pipeline as a production system.
What observability means in practice
Begin with user-visible service behavior. Define a small set of service level indicators such as successful checkout requests, time to render a report, or accepted ingestion jobs. State the measurement window, exclusions, source, and owner. The OpenTelemetry observability primer is especially useful for keeping the distinction clear: reliability is about whether the service does what users expect, while telemetry provides the evidence to investigate it. Infrastructure CPU alone cannot prove a customer completed the task.
| Decision area | Question to settle | Useful evidence |
|---|---|---|
| Service indicator | What user behavior matters? | Defined numerator, denominator, window, and owner. |
| Metric | What trend or threshold is being summarized? | Low-cardinality measurement with an action threshold. |
| Log | What event needs detailed context? | Structured record with safe correlation fields. |
| Trace | What work crosses component boundaries? | Spans with propagated context and semantic attributes. |
An operating model for observability
Instrument the request boundary, important internal operations, dependencies, queues, and asynchronous workers with consistent resource attributes: service name, environment, version, region when relevant, and deployment identity. Use semantic conventions rather than inventing slightly different attribute names per team. Decide what not to collect as carefully as what to collect. Remove secrets and unnecessary personal data, set retention by diagnostic value and obligations, and use sampling strategies that preserve important error and tail-latency evidence. A telemetry pipeline is itself a production dependency, so capacity and failure modes need monitoring. The W3C Trace Context Recommendation defines a standard propagation boundary for correlating work across services. The OpenTelemetry signals guidance provides a shared vocabulary for metrics, logs, and traces.
A practical observability implementation path
Start from an operational question. If users report slow checkout, a useful path is to examine the service-level latency indicator, filter errors by deployment revision, follow a sample trace through dependencies, and use structured logs for the failed transaction. Avoid alerts that only say a machine is busy when no action follows. An alert should identify a symptom, a severity based on user effect, a likely owner, and a link to the next inspection step. Link release events from CI/CD pipelines so a new failure is not investigated as though the system had not changed.
Observability risks and explicit controls
The common failure is high-volume, low-context telemetry that costs money while leaving responders unable to answer basic questions. Another is a dashboard packed with graphs but no decision threshold. Choose a small number of actionable alerts, use grouping and inhibition to avoid cascades, and send lower-severity signals to a review queue rather than paging by default. Instrumentation can leak identifiers and payloads, so data classification and redaction belong in code review. More data is not safer if it is unsearchable or unsafe to access.
| Stage | What to check | Decision rule |
|---|---|---|
| Detect | Alert on a user-relevant symptom. | Page only when prompt action can reduce impact. |
| Triage | Identify service, revision, and affected journey. | Use correlated metrics and logs to bound the issue. |
| Diagnose | Follow the request through dependencies. | Inspect a representative trace and safe event detail. |
| Improve | Add or refine the missing signal. | Validate the change in the next exercise or incident. |
Signals that show observability value
Measure the health of both the service and the observability system. For services: availability, latency, error rate, saturation, backlog, and completed business actions. For the pipeline: ingestion lag, dropped data, cardinality growth, query latency, alert delivery, and the percentage of incidents with usable correlation. Review alerts that were ignored, silenced, or escalated without useful context. They show where the system's feedback has become noise.
An observability checklist for the next change
Pick one customer journey and run a game-day fault through it. Confirm that a responder can find the affected deployment version, request path, error reason, dependency behavior, and recovery action within the intended response time. When the missing answer is found, add the minimum high-quality signal that answers it. The goal is not a bigger dashboard; it is a shorter path from symptom to a responsible decision.
Cardinality is an operational design limit, not merely a query-performance issue. Values such as user IDs, order IDs, raw URLs, and arbitrary error messages can create an unbounded number of time series or index entries. Put those details in appropriately protected event records when truly needed, while metrics use bounded labels such as route template, outcome, region, or dependency. A review of new instrumentation should ask this question before production traffic answers it expensively.
A worked observability decision
An order journey is successful only when an order is accepted and confirmed, not when its first HTTP request returns a status code. Instrument that journey with an outcome counter, an end-to-end duration histogram, a trace through payment and fulfillment, and structured error records. Attach the deployment revision to every signal. When confirmation slows, a responder can compare dependency spans with the prior revision and inspect a safe failure category without searching unrelated hosts.
How to phase observability adoption
Phase observability through one bounded service or workflow first. Establish the owner, evidence record, access boundary, and stop rule before standardizing a template or expanding automation. The first implementation should expose its awkward dependency, not hide it behind a happy-path demonstration. After the team can explain why the control exists and show its outcome, reuse only the conventions that made the decision clearer. This avoids turning a local tool choice into a broad platform mandate before its operating assumptions are tested.
Keep the working record close to the change. For observability, that means retaining the version or configuration involved, the person or automated identity that acted, the signal examined, the exception if there was one, and the recovery decision. This is not paperwork for its own sake. During a later failure, those few facts prevent responders from confusing an old condition with a new one or repeating an action whose effect is still unknown.
A useful observability review cadence
Review observability with real examples rather than a generic scorecard. Sample one normal outcome, one unexpected outcome, and one manual exception. Ask whether a new owner could locate the relevant evidence, understand the boundary, and decide what to do next without relying on private memory. A repeated exception points either to a missing capability or to a constraint that should be made explicit. In both cases, the review should create a small, owned improvement.
Run a deliberately limited exercise before widening use. Change one safe input, observe the stated signals, invoke the documented containment or recovery step, and verify that the intended service behavior returns. Record where access, timing, or ownership was unclear. An exercise is successful when it reveals a practical weakness early enough to repair it, not when every participant follows the expected script. That habit makes observability more dependable under ordinary pressure as well as during an incident.
Frequently asked questions
Question: What does observability add beyond monitoring? Answer: Monitoring checks known conditions, while observability helps explain unfamiliar internal states by connecting signals and preserving the context needed for investigation.
Question: Which observability signal should be added first? Answer: Choose the signal that answers the next investigation question: traces for a request path, metrics for trends, or logs for detailed events and decisions.
Observability is not synonymous with monitoring. Monitoring answers expected questions with defined checks; observability supports investigation of unexpected behavior through rich, correlated signals. Logs alone are rarely sufficient for distributed systems because they do not inherently connect an end-to-end request. Sampling is necessary at scale, but error paths and rare high-latency work need a deliberate retention strategy so the evidence needed in an incident is not discarded.
Conclusion
Observability pays off when it shortens uncertainty. Start with customer behavior, instrument meaningful boundaries, correlate telemetry with revisions and ownership, and reduce alerts to those that lead to action. The result is a system that helps people reason under pressure instead of asking them to search harder.
Design telemetry around questions
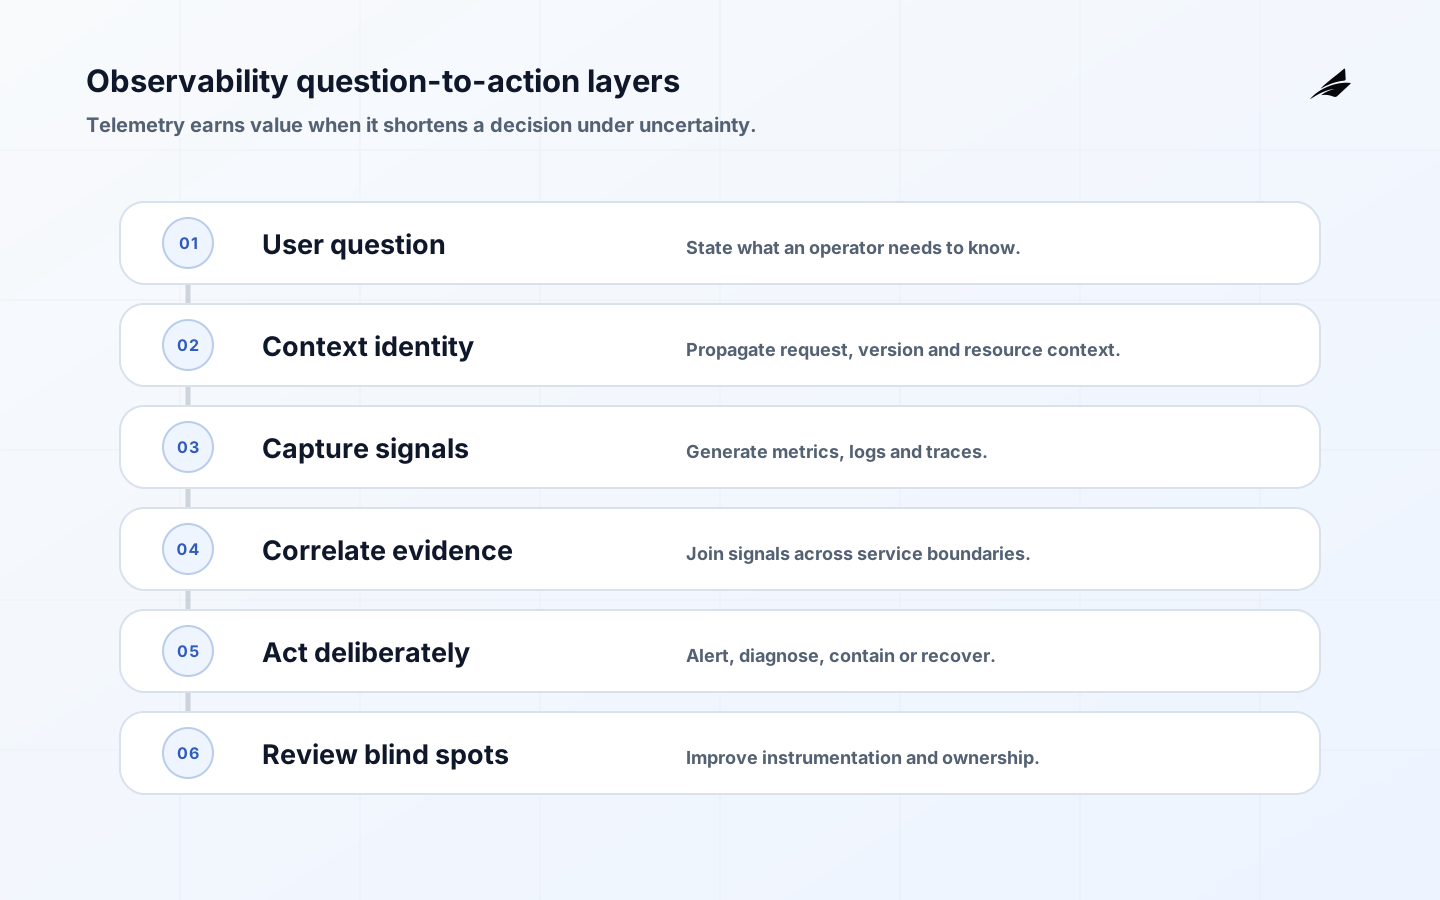
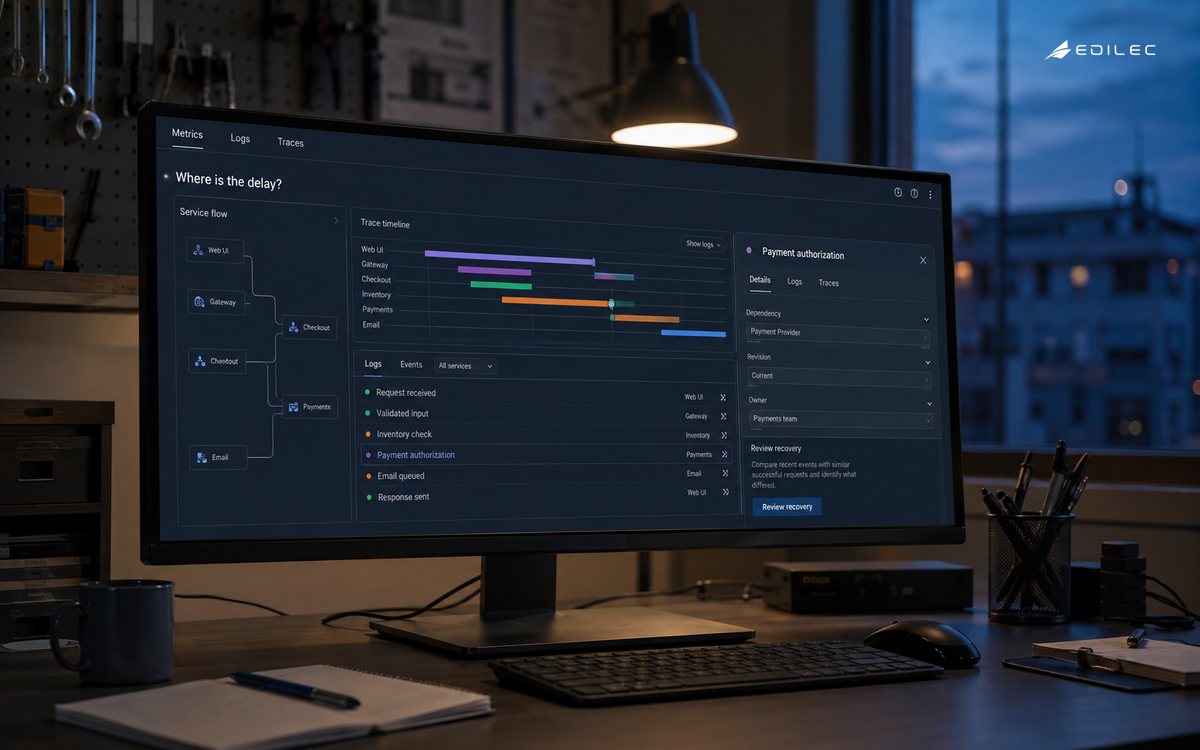
Observability begins with questions an operator must answer: what changed, who is affected, where is the delay, which dependency is failing and whether the customer outcome recovered. OpenTelemetry is a framework for generating, collecting and exporting traces, metrics and logs; it is not the backend or the alert policy. The OpenTelemetry primer connects telemetry to user-centered reliability and explains how traces join spans across a request path.
Define identity and context before selecting dashboards. Propagate correlation identifiers, record deployment and version attributes, protect sensitive fields, sample intentionally and monitor the telemetry pipeline itself. Use metrics for aggregation, logs for discrete evidence and traces for causal paths; join them through a shared resource and time model. Review a normal request, a slow request and an unknown failure to find missing context. Related material includes distributed tracing, log aggregation, and incident response planning.
Further Edilec context: Distributed tracing guide, Log aggregation playbook, Incident response planning. The operating decision applies those references specifically to the plain-language guide to observability.
Source trail: What is OpenTelemetry defines the framework and its limits; the observability primer connects signals to user reliability; OpenTelemetry documentation covers instrumentation and collectors; and Google SRE monitoring guidance grounds monitoring and alerting in action. Good observability makes unknown failures investigable.