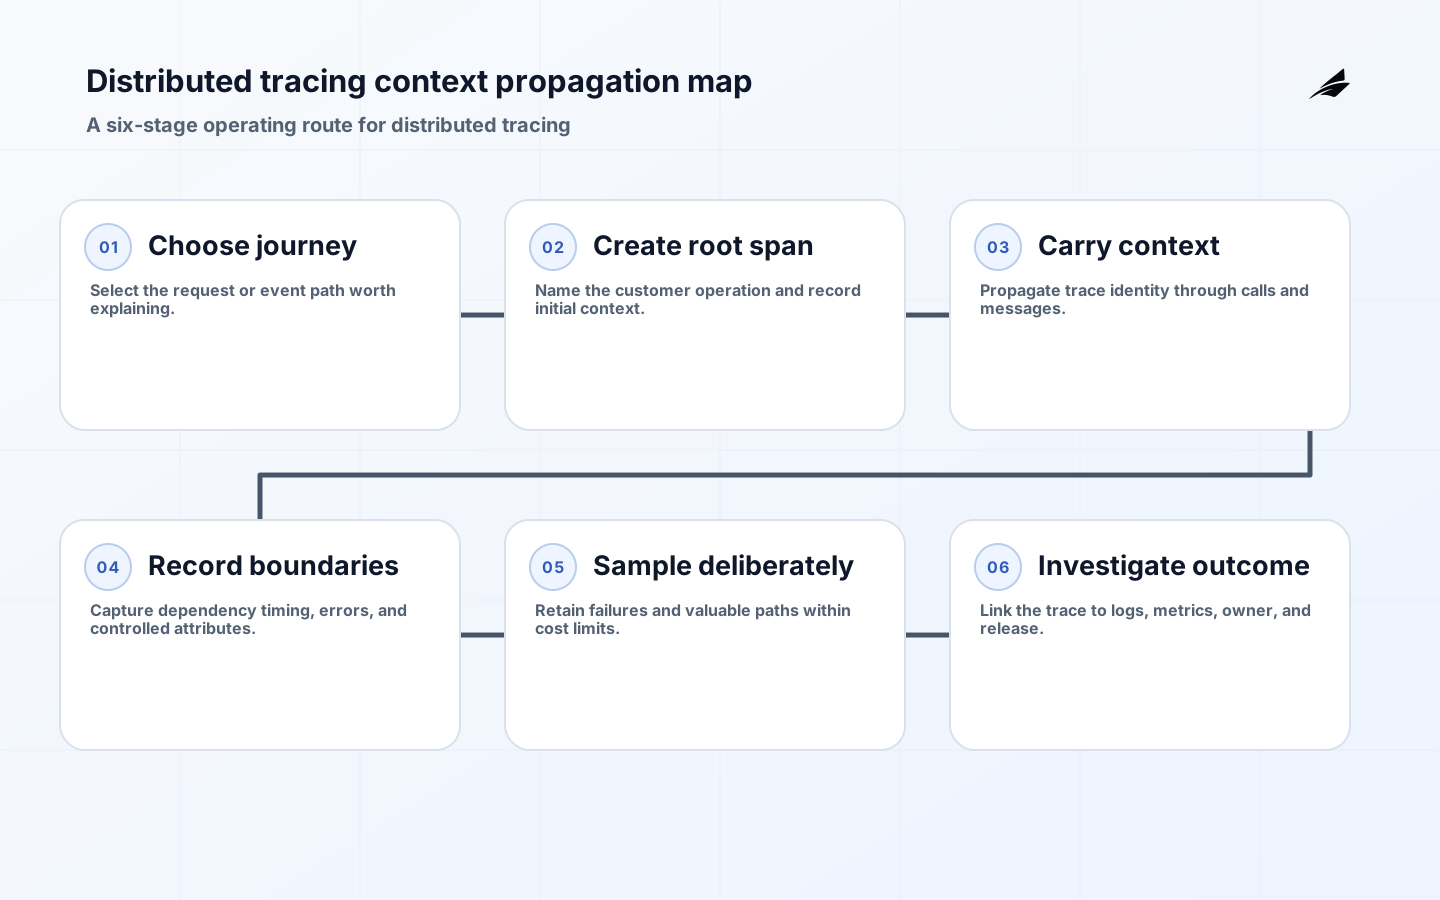
Distributed tracing needs an operating model, not a loose collection of tools. Distributed tracing records the path of a request or asynchronous operation across components as a trace made of spans. It is valuable when a team needs to understand where time was spent or where an error originated across service boundaries. It is not an automatic map of business truth: missing context, unsampled traces, and poorly named spans can make a trace look complete while hiding the decisive step. This guide focuses on the choices that make the work inspectable by the people who build, operate, and support it.
Key takeaways
- Define the boundary and accountable owner before standardizing distributed tracing.
- Keep the records that explain an outcome close to the action that created it.
- Use controls that match the consequence of failure instead of copying generic checklists.
- Test an uncomfortable but realistic failure path while impact is bounded.
- Measure recovery and operating effort alongside speed or throughput.
- Turn repeated exceptions into an owned improvement rather than private knowledge.
What distributed tracing means in practice
A trace has an identifier shared by related work; each span describes an operation with timing, attributes, and parent-child or causal relationships. The W3C Trace Context standard defines headers for carrying trace context across compatible HTTP boundaries. Messaging and background jobs require equivalent propagation and a deliberate model for fan-out, retries, and links between independent traces. For adjacent operating decisions, compare observability and CI/CD pipelines.
| Decision area | Question to settle | Useful evidence |
|---|---|---|
| Boundary | What part of distributed tracing is in scope? | Named owner, entry point, and expected outcome. |
| Identity | Which version, record, or state is authoritative? | An inspectable identifier tied to the action. |
| Control | What condition must hold before expansion? | A test, review, or policy result with a decision rule. |
| Recovery | How will the team verify a safe outcome? | A documented action, check, and accountable responder. |
An operating model for distributed tracing
Compare tracing options by instrumentation ecosystem, protocol compatibility, collector and storage operations, query experience, retention controls, sampling, security, and total cost. OpenTelemetry provides a vendor-neutral instrumentation and collection framework, while backends differ in search, service graphs, storage economics, and managed operations. Choose a path that integrates with existing logs and metrics rather than buying an isolated viewer. The design should make the next decision easier for someone who did not create the original implementation.

A practical implementation path
Instrument edge requests and the few dependencies that dominate latency or failure first. Standardize service, operation, environment, version, and error semantics; avoid recording secrets or unrestricted personal data as attributes. Deploy a collector with bounded queues and authenticated export, then test a traced request through a synchronous call and an asynchronous handoff. Define how developers will find traces from an incident ticket, log line, or metric alert. Prefer a sequence that creates evidence at every stage rather than a broad first release that makes causality difficult to recover.
Risks and controls to make explicit
Sampling is both a cost control and a potential blind spot. Head sampling can miss rare slow or failed requests before their outcome is known; tail-based decisions can retain interesting traces but require more processing and storage design. High-cardinality attributes may make queries expensive, and trace data can reveal system topology or customer behavior. Apply access, redaction, and retention policies before volume makes cleanup difficult. Write the exception route down as well: an emergency action may be necessary, but it should leave an attributable record and return to normal control once the immediate condition is resolved.
| Stage | What to check | Decision rule |
|---|---|---|
| Prepare | Scope, identity, access, and prerequisites. | Do not proceed when ownership or required evidence is unclear. |
| Change | The control that addresses the main failure mode. | Pause when a required test, policy, or review fails. |
| Observe | Technical and user-facing consequences. | Expand only when the agreed signals remain inside bounds. |
| Recover | State, data, and follow-up work. | Close only after the relevant verification is recorded. |
Signals that show whether it is working
Track trace completion, propagation coverage between services, collector drop rate, export latency, sampling rate by outcome, storage growth, query latency, and how often an incident can be linked to a representative trace. A large trace volume is not evidence of success. The meaningful outcome is faster, more confident isolation of the component, dependency, or release responsible for a user-visible condition. Review the signals with a real example, because a metric becomes useful only when it changes a decision or confirms that an earlier decision was sound.
A distributed tracing checklist for the next change
Use a trace review with a real slow request. Verify the root span represents the customer operation, child spans identify meaningful boundaries, context survives the queue or retry path, and attributes do not disclose sensitive values. Then disable one propagation link in a test environment and see whether the gap is observable; this prevents a false sense of end-to-end coverage. The result should be a short, owned change to the routine, not a retrospective statement that the team should have been more careful.
A worked decision example
A report request calls an API, enqueues a calculation, and later downloads a generated file. At first, the queue worker starts a new unrelated trace, so support cannot connect the download delay to the original request. The team propagates and links the trace context through the message, adds the report identifier as a controlled attribute, and configures error retention so failed calculations remain searchable even when normal traffic is sampled.
How to phase adoption
Adopt distributed tracing along a critical journey that crosses at least one meaningful dependency or asynchronous boundary. Instrument the edge first, establish naming and attribute conventions, then add the downstream calls that usually determine latency or failure. Test propagation through retries and messages before declaring coverage complete. A small, coherent trace set is more useful than a large collection of spans that cannot be connected to a customer operation or a service owner.
Decision records and ownership
Keep a tracing decision record that identifies the root operation, propagation mechanism, required resource attributes, approved business identifiers, redaction rule, sampling policy, storage location, retention, and on-call query path. Link the record to the metric alert or support workflow that will use it. This avoids a frequent adoption problem: one team pays for trace storage while another team cannot find a representative trace or does not know whether it is allowed to inspect the attributes.
Design boundaries that matter
A tracing backend comparison should include the path from instrumentation to an on-call decision. Assess language support, automatic and manual instrumentation, collector deployment, authentication, storage model, query language, service maps, trace-log correlation, retention, export controls, and operational ownership. A feature list alone cannot reveal whether engineers can find the trace behind a ticket at two in the morning or whether platform staff can keep the pipeline reliable at expected volume. Run a representative query and an access-control review with candidate systems before committing to a long-term storage model.
Deeper operating considerations
Trace semantics are part of the product contract. Name operations for the work performed, not the implementation detail of a helper method, and attach attributes that help distinguish outcomes without exposing sensitive content. Decide whether a retry creates a child span, a linked attempt, or a separate trace based on the causal relationship responders need to understand. Asynchronous fan-out may require links rather than a misleading parent-child tree. Document these rules and provide small instrumentation examples. Consistent semantics make traces comparable across teams and prevent a backend from becoming a collection of attractive but ambiguous timelines.
A useful review cadence
Review a trace for a normal request, an error, and a slow asynchronous job. Check that the critical span relationships are causal rather than merely chronological, that attributes remain safe to retain, and that the chosen sampling policy keeps the evidence needed for failures. Measure collector drops and query delay as operational signals, not just backend availability. Each review should result in a precise instrumentation or governance correction rather than a vague request for more tracing.
Frequently asked questions
Distributed tracing does not require microservices, though the return is often highest where work crosses independently operated boundaries. Vendor-neutral instrumentation can reduce lock-in, but it does not eliminate backend migration work or schema discipline. Retain traces according to diagnostic value and privacy constraints, not because longer retention feels safer.
Before expanding the practice
Before standardizing a tracing library, make context propagation part of integration acceptance. Test inbound and outbound HTTP, queue messages, scheduled jobs, and third-party boundaries where headers may be stripped or translated. Record the intended behavior for each case, including how a trace starts when no trusted parent context exists. A consistent propagation contract means a trace gap becomes a detectable integration defect rather than a mystery in a production investigation. It also helps security reviewers distinguish correlation identifiers from credentials or business data, so teams can preserve diagnostic continuity without accidentally forwarding sensitive information across a trust boundary.
A final field test
Field test: follow one trace across an HTTP call and queued job, then confirm the relevant logs and metrics retain the same context without exposing sensitive attributes. A break in that route is an integration issue to own.
Conclusion
Distributed tracing should create reliable causal evidence across the boundaries where ordinary logs stop. Start with the critical journey, make propagation testable, and select storage and sampling rules the team can afford to operate.