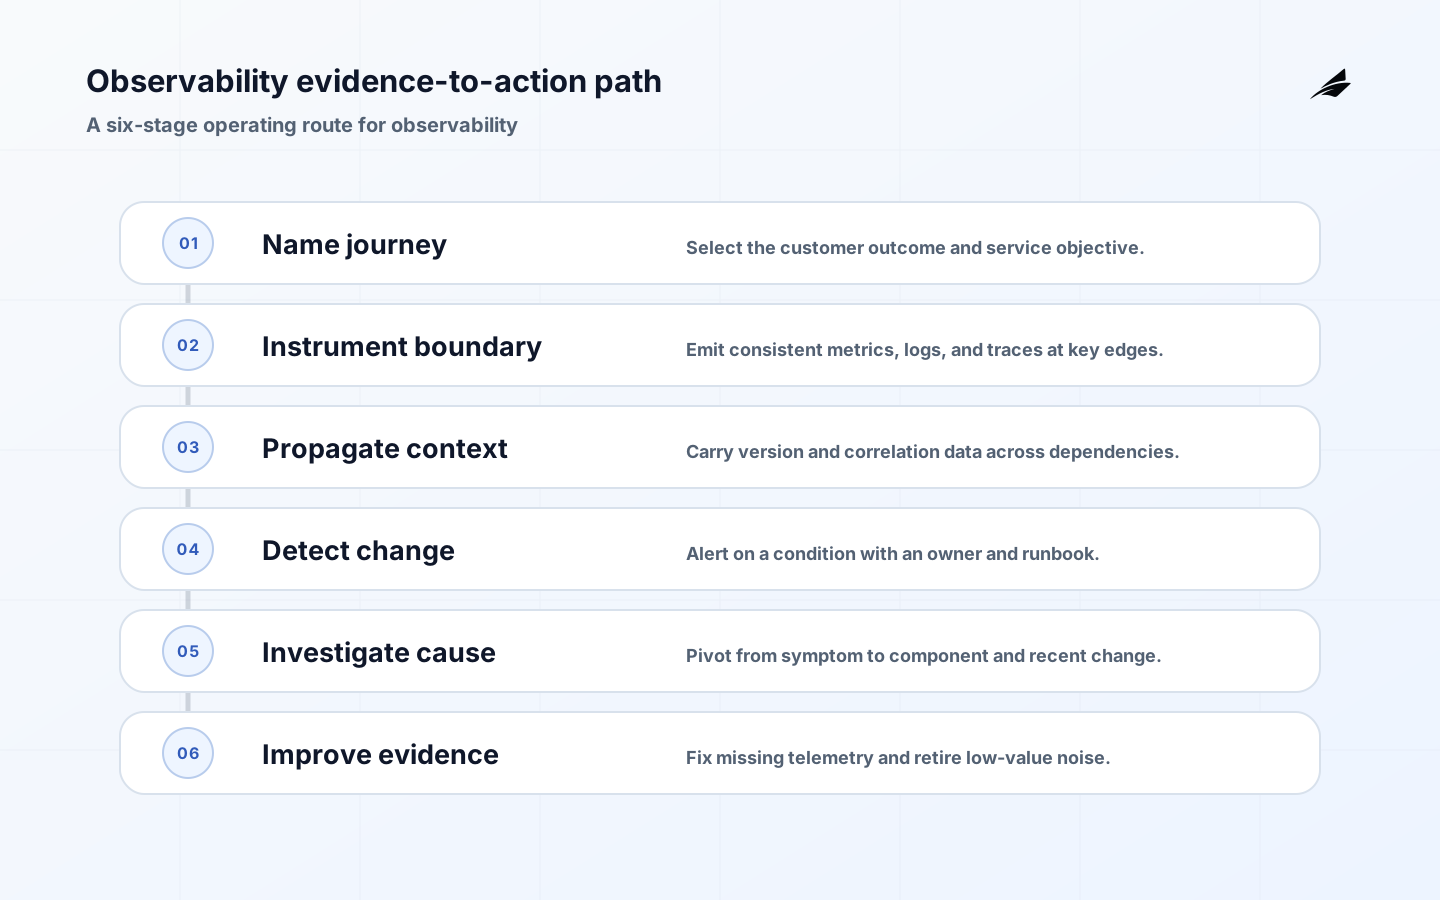
Observability needs an operating model, not a loose collection of tools. Observability is the ability to infer a system’s internal state from the evidence it produces, then use that evidence to decide what to do. It is not a dashboard count. A useful observability design connects customer journeys, service boundaries, telemetry signals, response ownership, and retention cost so that an unexpected outcome can be investigated without private knowledge. This guide focuses on the choices that make the work inspectable by the people who build, operate, and support it.
Key takeaways
- Define the boundary and accountable owner before standardizing observability.
- Keep the records that explain an outcome close to the action that created it.
- Use controls that match the consequence of failure instead of copying generic checklists.
- Test an uncomfortable but realistic failure path while impact is bounded.
- Measure recovery and operating effort alongside speed or throughput.
- Turn repeated exceptions into an owned improvement rather than private knowledge.
What observability means in practice
Metrics summarize numeric behavior over time, logs provide discrete event context, and traces connect work across service boundaries. Each signal has trade-offs in cardinality, volume, query cost, and diagnostic value. Instrumentation should answer questions a team expects to face: is the service available, which dependency slowed the request, did an authorization decision change, and which version handled the work? For adjacent operating decisions, compare distributed tracing and incident response.
| Decision area | Question to settle | Useful evidence |
|---|---|---|
| Boundary | What part of observability is in scope? | Named owner, entry point, and expected outcome. |
| Identity | Which version, record, or state is authoritative? | An inspectable identifier tied to the action. |
| Control | What condition must hold before expansion? | A test, review, or policy result with a decision rule. |
| Recovery | How will the team verify a safe outcome? | A documented action, check, and accountable responder. |
An operating model for observability
Start from a small set of service-level indicators and user-critical journeys, then define the telemetry needed to explain a breach. Attach resource attributes such as service name, environment, version, and region consistently. Propagate correlation context across HTTP, messages, and asynchronous work. Give every alert a runbook, an owner, and a meaningful condition; an alert that cannot guide a next action is a notification, not a control. The design should make the next decision easier for someone who did not create the original implementation.

A practical implementation path
Instrument one request path before deploying an all-purpose collector. Use structured logs with stable fields, counters and histograms for bounded measurements, and traces at the external and dependency boundaries. Set sampling deliberately: retain errors and rare high-value paths while controlling normal-volume cost. Test a production-like failure and confirm a responder can pivot from an alert to a trace, relevant logs, and the responsible deployment revision. Prefer a sequence that creates evidence at every stage rather than a broad first release that makes causality difficult to recover.
Risks and controls to make explicit
Telemetry can expose personal data, tokens, internal identifiers, and costly high-cardinality labels. Redact at the source where possible, define access and retention boundaries, and do not place unbounded values such as user IDs in metric labels. The opposite risk is under-instrumentation: a generic error count cannot distinguish a bad release from a database pool exhaustion or a third-party outage. Write the exception route down as well: an emergency action may be necessary, but it should leave an attributable record and return to normal control once the immediate condition is resolved.
| Stage | What to check | Decision rule |
|---|---|---|
| Prepare | Scope, identity, access, and prerequisites. | Do not proceed when ownership or required evidence is unclear. |
| Change | The control that addresses the main failure mode. | Pause when a required test, policy, or review fails. |
| Observe | Technical and user-facing consequences. | Expand only when the agreed signals remain inside bounds. |
| Recover | State, data, and follow-up work. | Close only after the relevant verification is recorded. |
Signals that show whether it is working
Measure alert precision, time to detect, time to identify a failing component, time to restore, telemetry ingestion volume, query latency, dropped spans, and coverage of critical journeys. Review dashboards after real incidents: panels that were not consulted can be retired or simplified, while repeated manual joins point to a missing correlation field or a poor service boundary. Review the signals with a real example, because a metric becomes useful only when it changes a decision or confirms that an earlier decision was sound.
A observability checklist for the next change
Choose a known failure mode, such as a dependency latency spike, and conduct a short evidence walk-through. Starting from the customer symptom, a responder should locate the service objective impact, the version or region involved, the slow dependency, and the relevant owner. Record the missing field or query instead of compensating with more generic dashboards. The result should be a short, owned change to the routine, not a retrospective statement that the team should have been more careful.
A worked decision example
Checkout latency rises only for one region after a configuration rollout. A useful implementation shows the affected service and region in the latency metric, carries the request trace context into the payment call, includes the configuration revision in structured logs, and has an alert linked to a runbook. The team can compare the region with baseline, stop the rollout, and later explain why the dependency pool saturated.
How to phase adoption
Adopt observability by starting with one customer journey and the operating question attached to it. Define the service objective, owner, threshold, and first diagnostic pivot before instrumenting every component. Add the metric, structured event, and trace boundary needed to explain a plausible breach, then run a production-like failure and confirm that the evidence leads to a specific action. This approach produces useful telemetry sooner and avoids expensive collections of data that no responder can interpret.
Decision records and ownership
Maintain a telemetry decision record that names the journey, signals, attributes, data classification, sampling or aggregation rule, retention, access boundary, alert owner, and runbook. Include the version and environment conventions so a responder can compare a new release with its baseline. This record makes privacy and cost review practical: teams can identify which signal contains sensitive fields or unbounded values without treating the entire observability platform as one undifferentiated data source.
Design boundaries that matter
Service objectives should connect telemetry to a decision about user experience. Choose an indicator that represents the service promise, such as successful requests, fresh results, or completed jobs, then define an objective and error budget that fit the consequence of failure. The threshold is not a universal uptime number. It should reflect what users notice and what the team can meaningfully change. A good objective clarifies when to slow feature delivery, investigate a dependency, or accept a temporary degradation. It also stops dashboards from optimizing a convenient internal measurement while the customer journey is deteriorating elsewhere.
Deeper operating considerations
Telemetry schemas need governance just like application APIs. Standardize time units, error conventions, service identity, environment labels, and the treatment of tenant or user data before teams create incompatible dashboards. Review new high-cardinality fields and log attributes for privacy, access, and retention impact. Prefer a controlled identifier with a documented lookup path over placing raw personal information in every event. When the schema changes, version it or provide a migration period so alerts and investigations do not silently break. These habits keep observability useful as systems and teams multiply.
A useful review cadence
Review one alert that led to action, one alert that was ignored, and one investigation that required a manual data join. Validate that the alert threshold still reflects user impact, retire or tune noisy notifications, and add the correlation field that would have shortened the investigation. Inspect ingestion and query cost with the same care as technical coverage. The purpose is not maximum telemetry; it is evidence that reduces uncertainty before the next operational decision.
Frequently asked questions
Observability is not identical to monitoring. Monitoring commonly checks known conditions; observability provides rich evidence for investigating unknown or changing conditions. Do not begin by collecting every possible signal. Begin with decisions that matter, then choose telemetry that can support those decisions without creating unaffordable storage, privacy exposure, or alert fatigue.
Before expanding the practice
Before scaling telemetry collection, model the cost and retention of each signal. High-volume debug logs and fully sampled traces may be valuable during a launch, but retaining them indefinitely can obscure the small set of evidence responders actually use. Define normal and incident modes where appropriate, with safeguards so elevated collection does not itself destabilize a workload or expose sensitive data. Give teams transparent usage reports and a way to request a justified exception. Observability is easier to sustain when its costs, privacy limits, and diagnostic benefits are visible to the same people who decide what to instrument.
A final field test
Field test: start from an alert and time the route to the responsible service, version, dependency, and runbook. The telemetry design should make that path shorter than a manual search across disconnected tools. Record the elapsed time, the missing evidence if any, and one owned improvement before the next release. Keep the result visible to the on-call owner.
Conclusion
Observability becomes operationally valuable when it shortens the route from symptom to informed action. Instrument important journeys, govern the data, and improve the evidence after each real investigation.